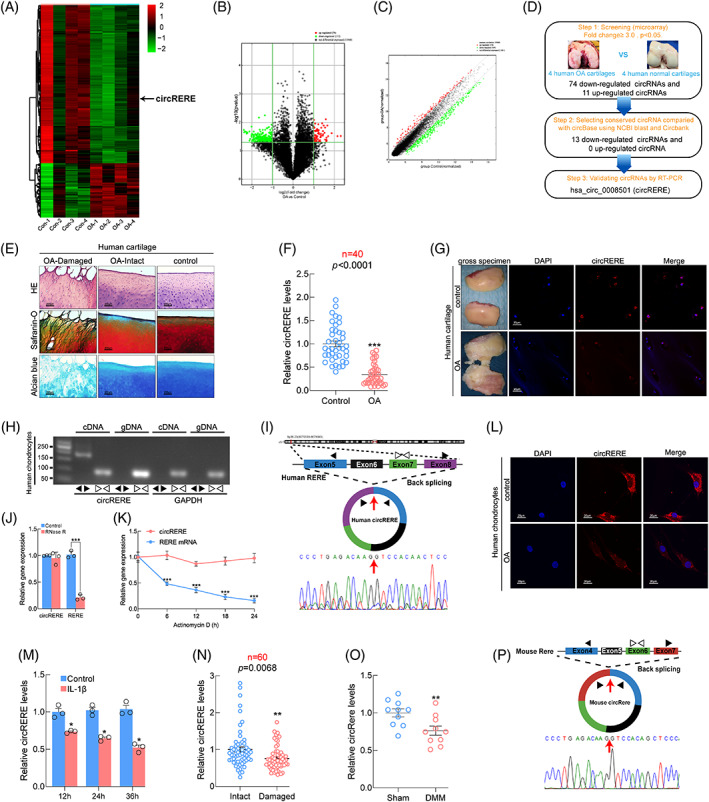
FIGURE 1.

Identification of circRERE in human chondrocytes and cartilage. (A) Heat map representing differentially expressed circRNAs between human control and osteoarthritis (OA) cartilage (Fold change≥2, p < 0.05). CircRERE is indicated. (B, C) Volcano and Scatter plots illustrating the statistical significance of differentially expressed circRNAs. (D) Steps for identification of circRERE. (E) Representative histomorphological staining of human damaged and intact OA cartilage and control cartilage. Scale bar, 200 μm. (F) QRT‐PCR for expression of circRERE in human control and OA cartilage (n = 40). ***p < 0.01 by Mann–Whitney U test. (G) fluorescence in situ hybridization (FISH) of circRERE in human control and OA cartilage. Scale bar, 20 μm. (H, I) Validation of circRERE in HCs by RT‐PCR and Sanger sequence. (J) QRT‐PCR for the expression of circRERE and RERE in HCs treated with or without RNase R (n = 3). ***p < 0.001 by two‐tailed unpaired t test. (K) QRT‐PCR for the abundance of circRERE and RERE in HCs treated with Actinomycin D at indicated time (n = 3). ***p < 0.001 by two‐way ANOVA with Tukey's post hoc test. (L) FISH of circRERE in human control and OA chondrocytes. Scale bar, 20 μm. (M) Changes of circRERE in IL‐1β‐stimulated (10 ng/mL) HCs at indicated time. *p < 0.05 versus control by two‐way ANOVA with Tukey's post hoc test. (N) Relative expression of circRERE in human paired damaged and intact OA cartilage (n = 60). **p < 0.01 by two‐tailed Wilcoxon matched‐pairs signed rank test. (O) QRT‐PCR for expression of circRere in mouse cartilage from DMM and sham groups (n = 10). **p < 0.01 by two‐tailed unpaired t test. (P) Validation of circRere by Sanger sequence. Data are presented as mean ± SEM
