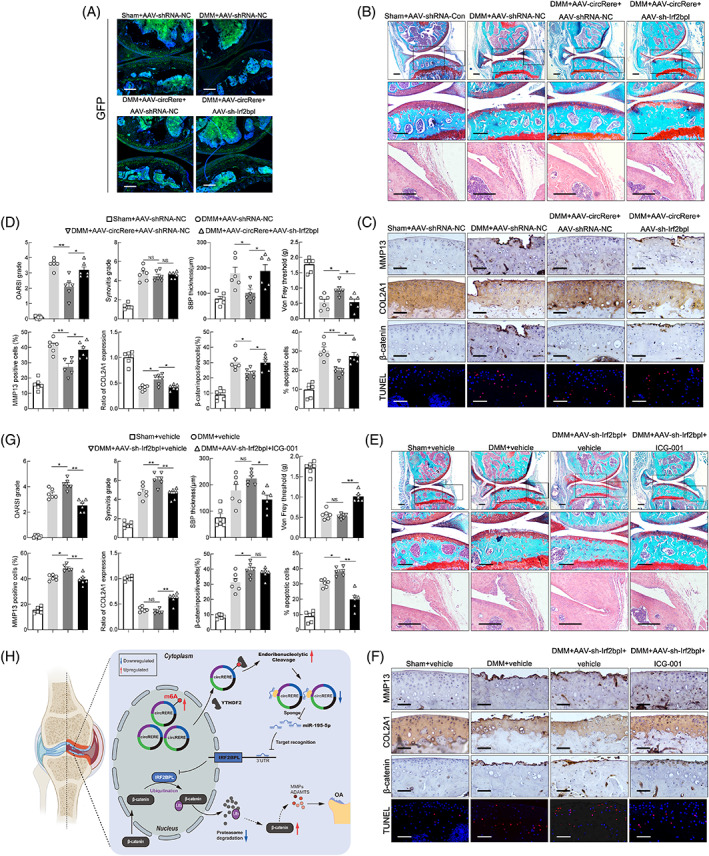
FIGURE 6.

The role of circRere/miR‐195a‐5p/Irf2bpl/β‐catenin axis in the progression of DMM‐induced osteoarthritis (OA). (A) To investigate the infected efficiency of AAVs, representative knee cartilage fluorescence (GFP) images in knee sections from four groups were obtained by a confocal microscope. Scale bar, 200 μm. (B) Representative images of Safranin O‐fast green and HE staining in knee sections from four groups 8 weeks after DMM. Scale bar, 200 μm. (C) IHC staining for MMP13, COL2A1 and β‐catenin and TUNEL assay in mouse cartilage from above four groups. Scale bar, 50 μm. (D) Scoring of OA parameters. Quantification of MMP13, COL2A1 and β‐catenin expression, and apoptotic chondrocytes in mouse cartilage (n = 6). *p < 0.05, **p < 0.01 by one‐way ANOVA with Tukey's post hoc test. (E) Representative images of Safranin O‐fast green, HE staining in knee sections from four groups 8 weeks after DMM. Scale bar, 200 μm. (F) IHC staining for MMP13, COL2A1 and β‐catenin and TUNEL assay in mouse cartilage from four groups. Scale bar, 50 μm. (G) Scoring of OA parameters. Quantification of MMP13, COL2A1 and β‐catenin expression, and apoptotic chondrocytes in mouse cartilage (n = 6). *p < 0.05, **p < 0.01 by one‐way ANOVA with Tukey's post hoc test. (H) Proposed schematic of m6A‐moidified circRERE and downstream targets during the pathogenesis of OA. Data are presented as mean ± SEM
