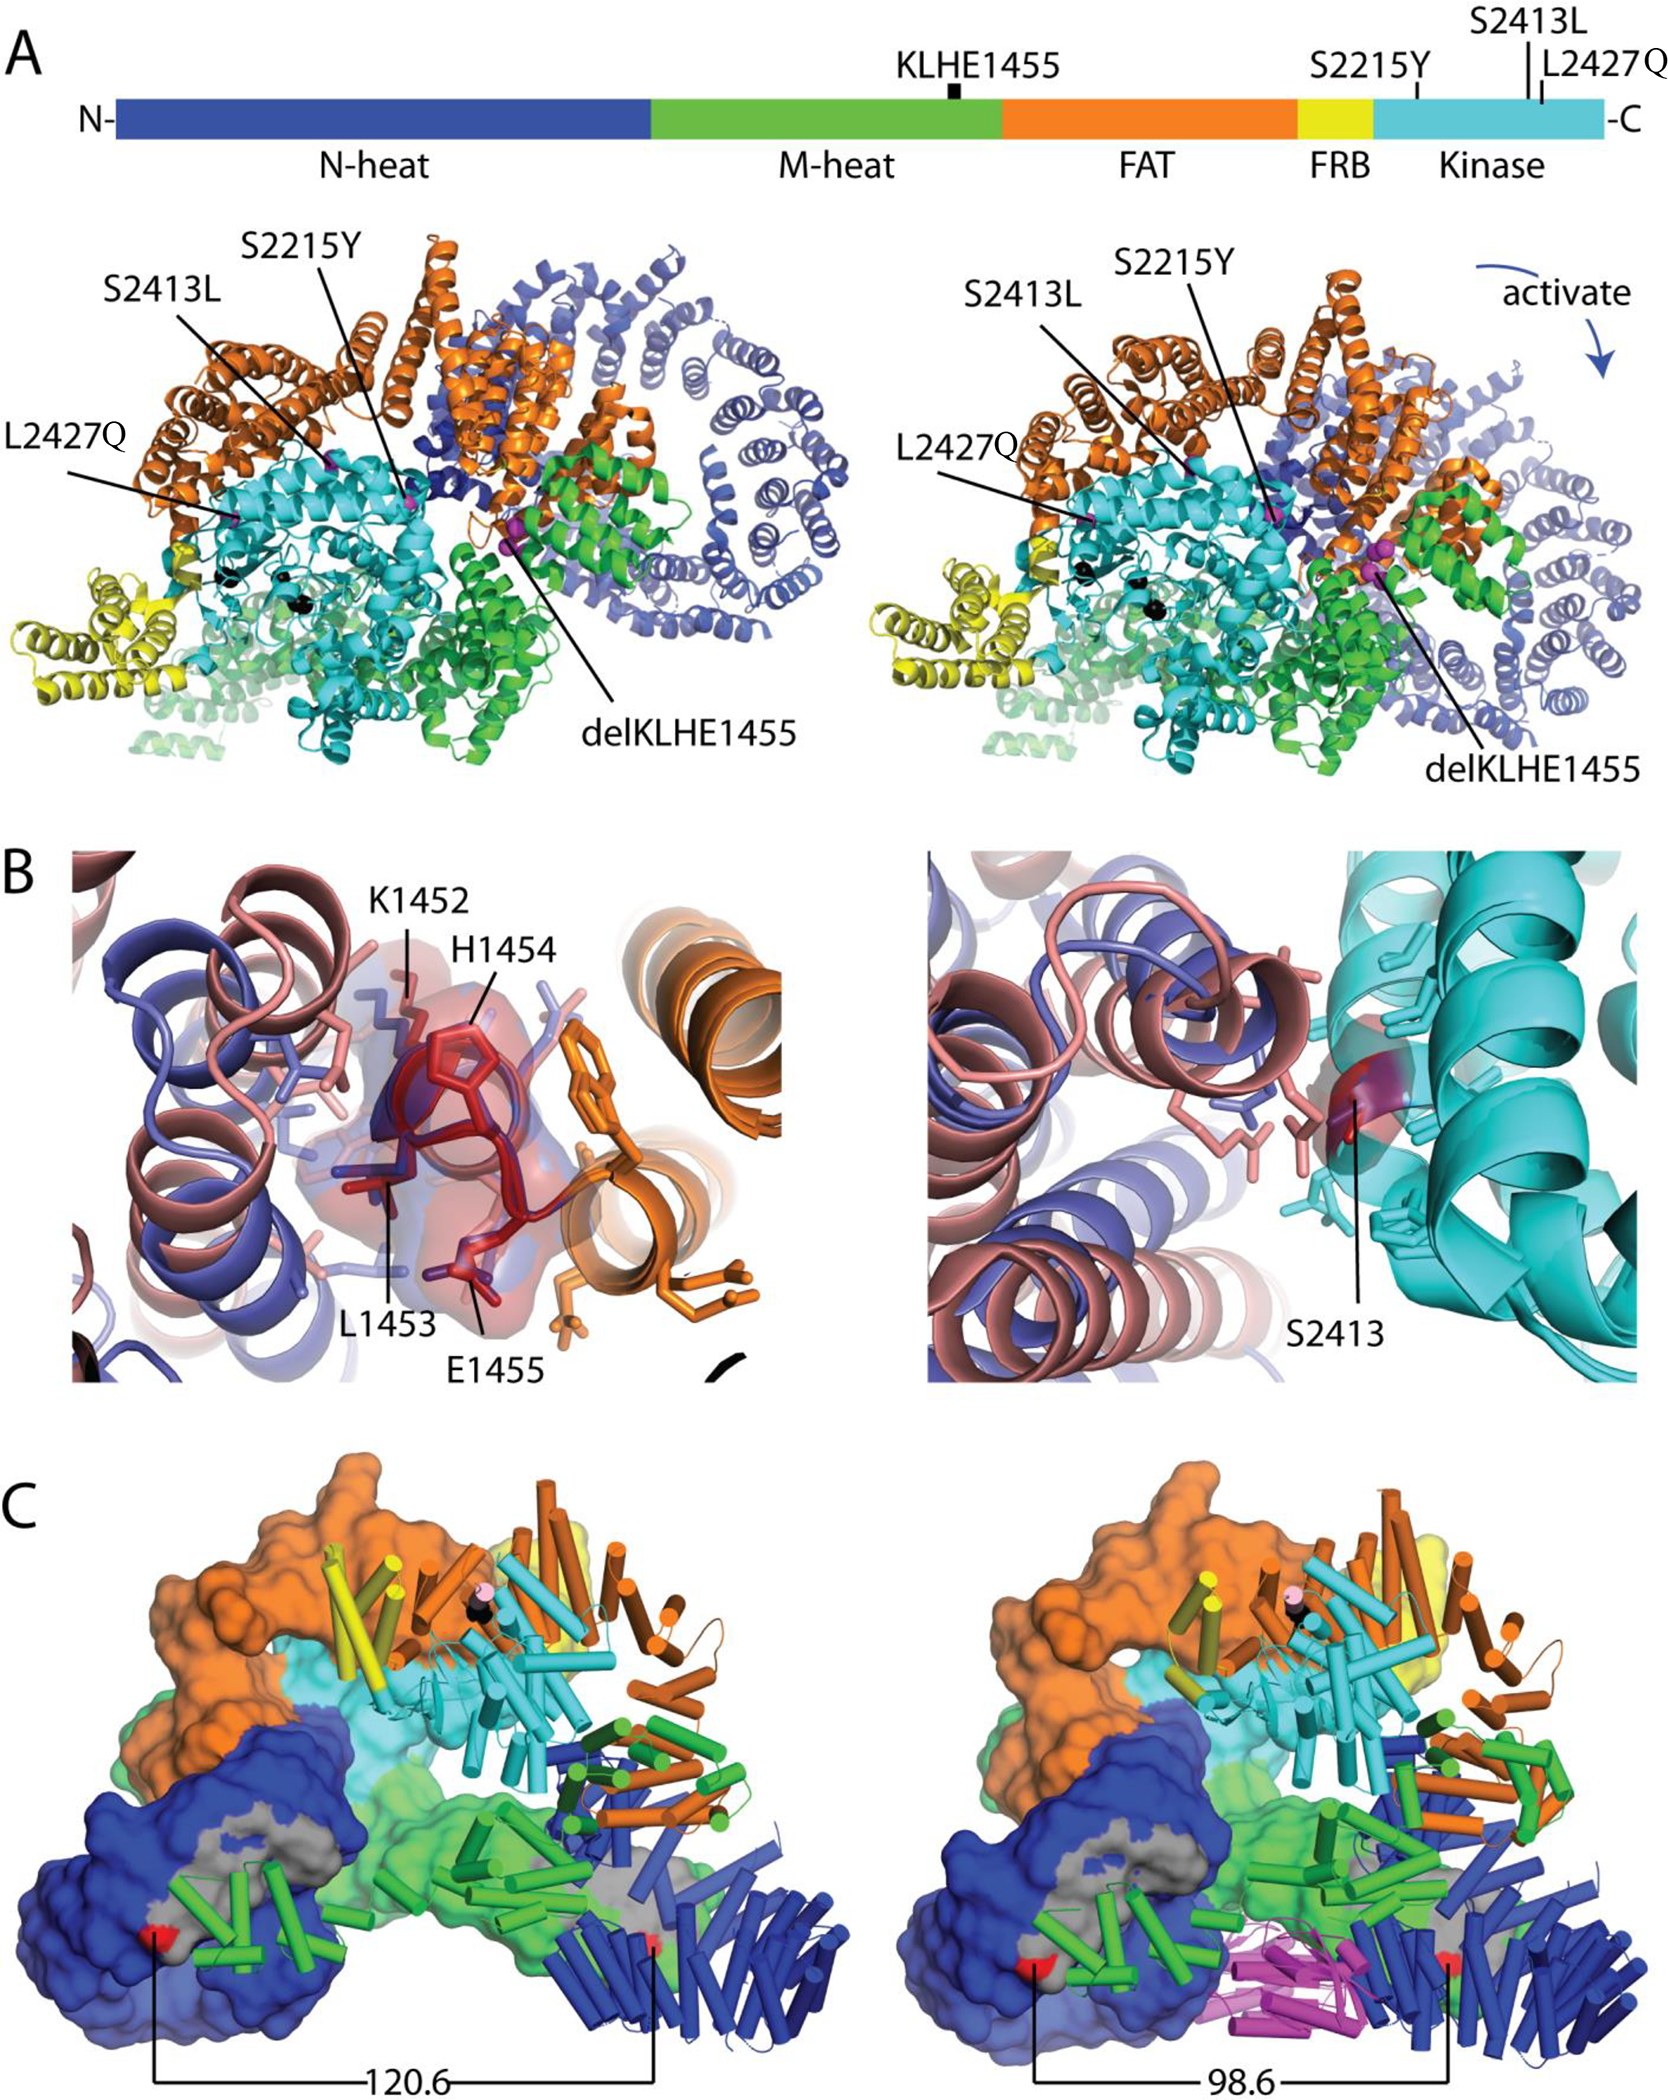
Figure 2. Schematic mapping of mTOR mutations in LOT samples.

(A) Mutation positions in the mTOR protein primary structure as well as tertiary structures of apo mTORC1 (PDB: 6bcx, left) and RHEB-activated mTORC1 (PDB: 6bcu, right) with colored domains. (B) Structure context of less well characterized mTOR mutations. Left: Superimposed wild type mTOR FAT domain hinge region (orange) with area corresponding to K1452-E1455 (deleted in LOT 6) illustrating differential interactions with neighboring FAT helices in apo (slate) and RHEB activated (salmon) conformations. Residues within 4Å are in stick. Right: Superimposed kinase C-lobes (cyan) containing the S2413I mutation (LOT 5). The mutation is positioned at the FAT domain interface, which adopts alternate conformations in the active (salmon) and apo (slate) states. Residues within 4Å are in stick. (C) mTORC1 dimerization interface is incompatible with mixed dimers. Left: mTOR dimer (domains colored as above) from an apo mTORC1 structure (PDB: 6BCX) with one chain in surface rendering and the second chain in cartoon mode. The dimer interface (gray) is formed by interaction of N-heat (dark blue) and M-heat domains (green), with the distance between two residues in the dimer interface (N612 and R1161, red) indicated below. Right: RHEB (magenta)-activated mTOR dimer with closer interaction surfaces as shown by the distance between N612 and R1161 (red).
