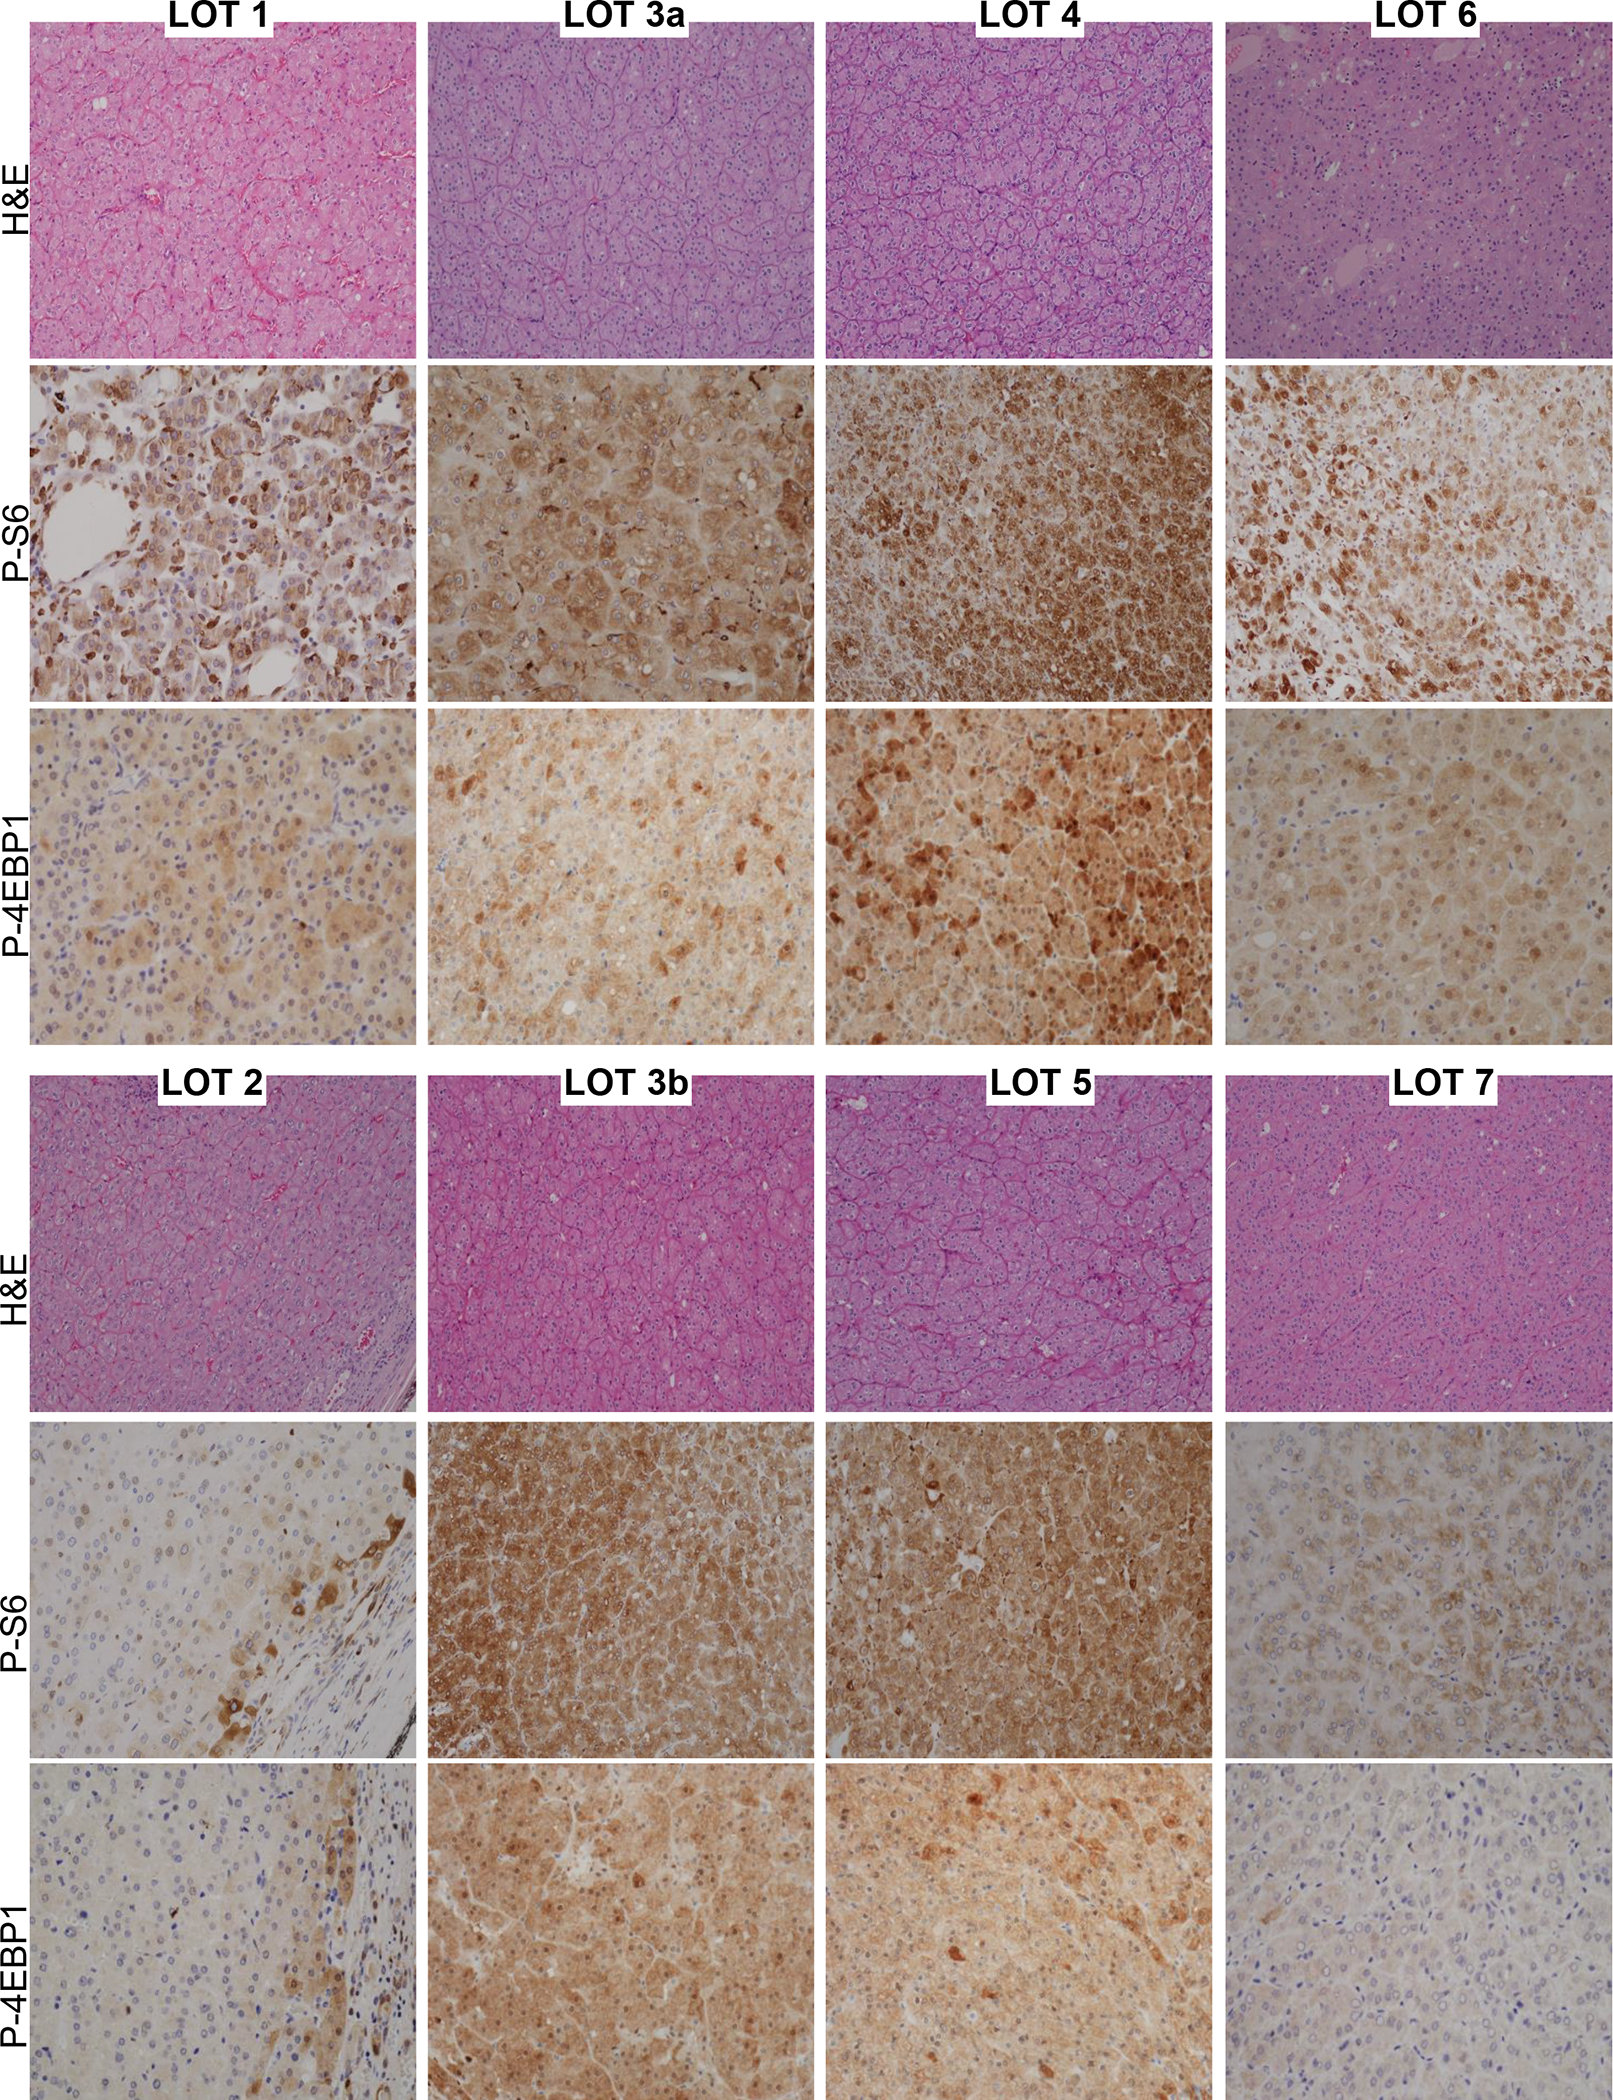
Figure 3. Evaluation of mTORC1 pathway activation in LOT.

Representative H&E, p-S6, and p-4EBP1 immunohistochemical expression in LOTs. The percentage of tumor cells expressing cytoplasmic phospho-S6 and the intensity of expression is tabulated in the Table 2.
