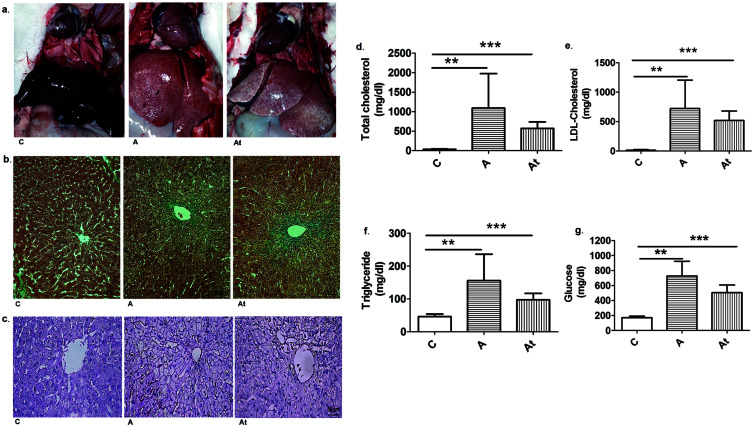
Fig. 1. Lipid accumulation in liver and serum.
(a) Macroscopic appearance of hepatic tissue of the control group (C) and hyperlipidemic animals treated with statins and anti PCSK9 antibody (At) or not treated (A). (b) Representative Masson’s trichrome stained sections of rabbit liver from the control (C), untreated (A), and treated (At) groups. Nuclei are stained dark red/purple, cytoplasm is stained red/pink, and connective tissue is stained blue. Objective ×20. (c) Original hematoxylin-eosin (HE) stained images of liver sections. Objective ×40. Biochemical lipid and glucose assays in sera from the three study groups at 12 weeks are total cholesterol (d), LDL-cholesterol (e), triglycerides (f) and glucose (g). Serum levels of all animal groups included in the study are shown. Assay results are mean±standard deviation (SD) from seven biological replicates. Statistical evaluation was carried out using the Student t-test for unpaired samples. **p<0.01; ***p<0.001.

