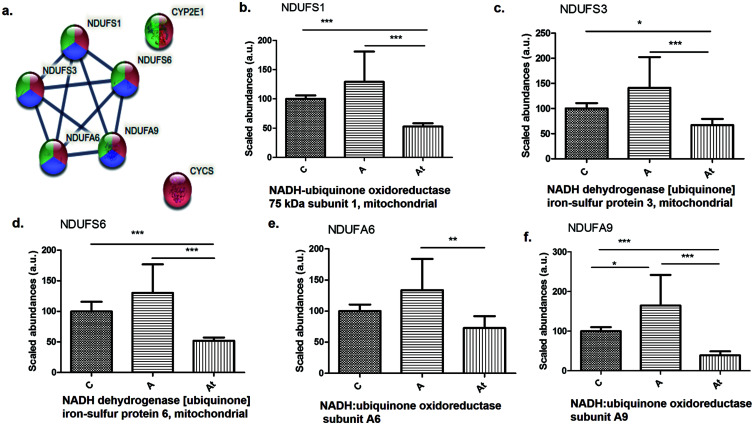
Fig. 4. Protein-protein interaction in the nonalcoholic fatty liver disease pathway.
(a) Highlighted by STRING v.11.5 analysis. (b–f) Identification and quantification of proteins in this pathway in the three study groups. Data are mean±SD from three biological replicates, each with three technical replicates. *p<0.05, **p<0.01, ***p<0.001 versus the control group.

