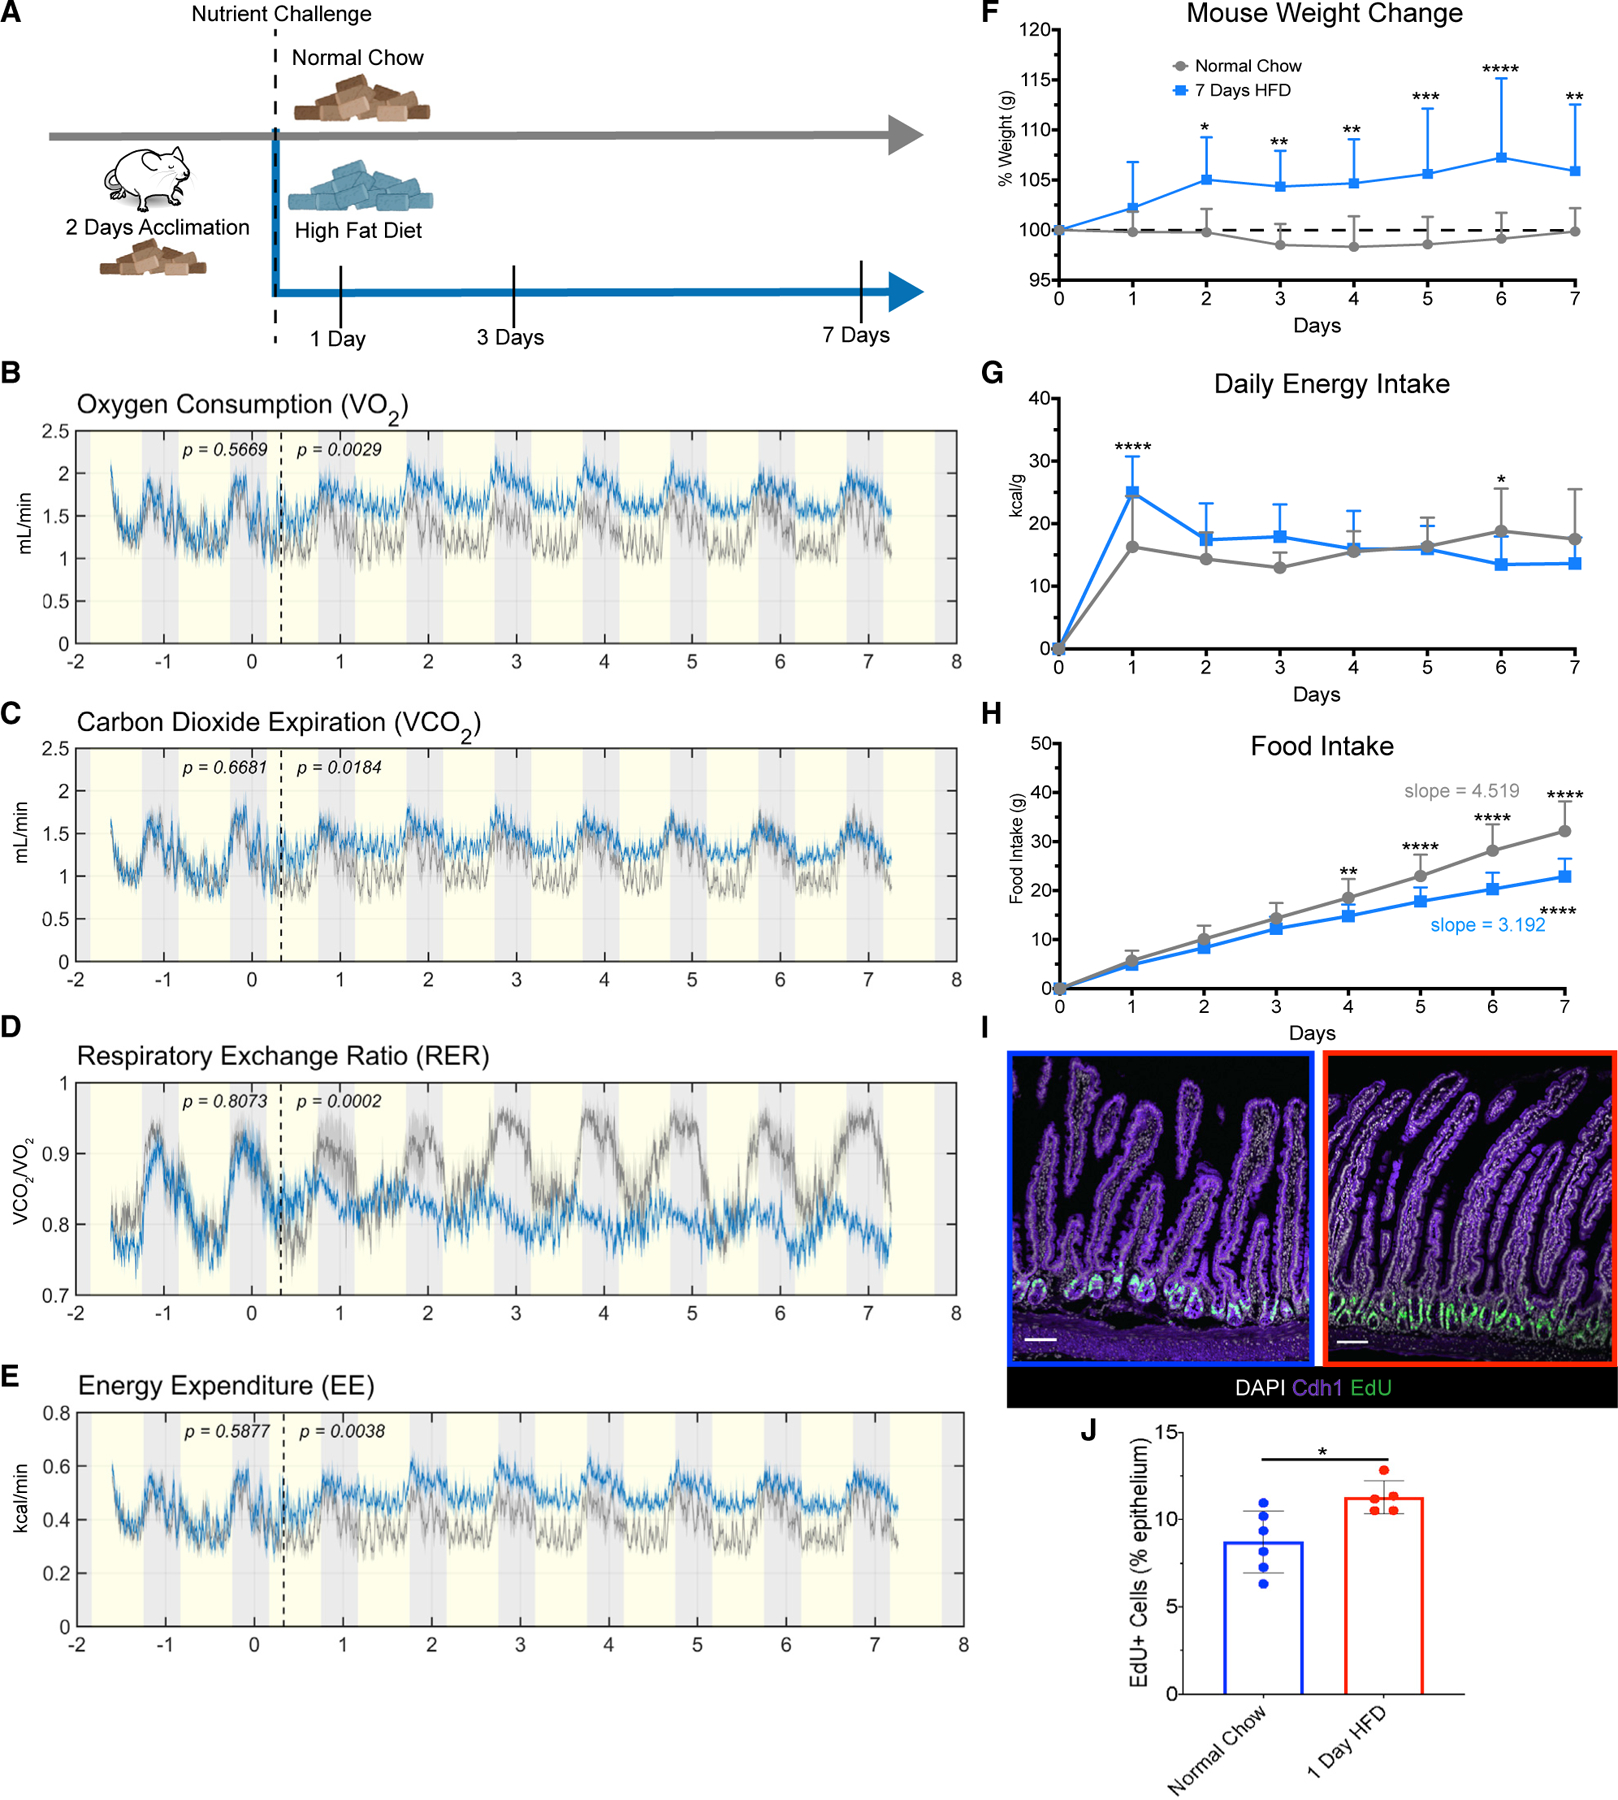
Figure 1. One day of HFD induces changes in mouse metabolism and intestinal proliferation.

(A) Diagram of feeding schedule in metabolic cages. Mice underwent 2 days of acclimation to the cages, and all consumed normal chow (brown-color pellets) during the acclimation period. The dashed line denotes when mice were divided into two groups, one maintained on normal chow (n = 5), and the other group switched to high-fat diet (HFD; n = 6) for 7 days.
(B) Average oxygen consumption.
(C) Average carbon dioxide expiration rate.
(D) Average respiratory exchange rate ratio calculated by VCO2/VO2.
(E) Average energy expenditure measured in kcal/min captured from animals fed normal chow (gray line) and HFD (blue line). Yellow shading indicates light cycle, whereas gray shading indicates night cycle. The dashed line indicates the end of the acclimation period and beginning of dietary challenge.
(F) Percentage of daily weight change measured in grams (g), n = 11 normal chow, n = 20 HFD.
(G) Average daily energy intake measured in kcal/g, n = 11 normal chow, n = 20 HFD.
(H) Average accumulated food intake over time with calculated average slopes displayed, n = 11 normal chow, n = 20 HFD.
(I) Immunofluorescence images of the proximal jejunum of mice fed normal chow (blue border) and 1 day of HFD (red border) after a 2 h pulse with EdU to label actively proliferating cells (green). Nuclei are stained in white, and Cdh1 marks the epithelium in purple. Scale bars: 100 μm.
(J) Quantification of (I), n = 6 normal chow, n = 5 HFD.
(B–E and J) One-way ANOVA. Error bars are SD. (F–H) Two-way ANOVA; *p < 0.05, **p < 0.0005, ***p < 0.0003, ****p < 0.0001.
