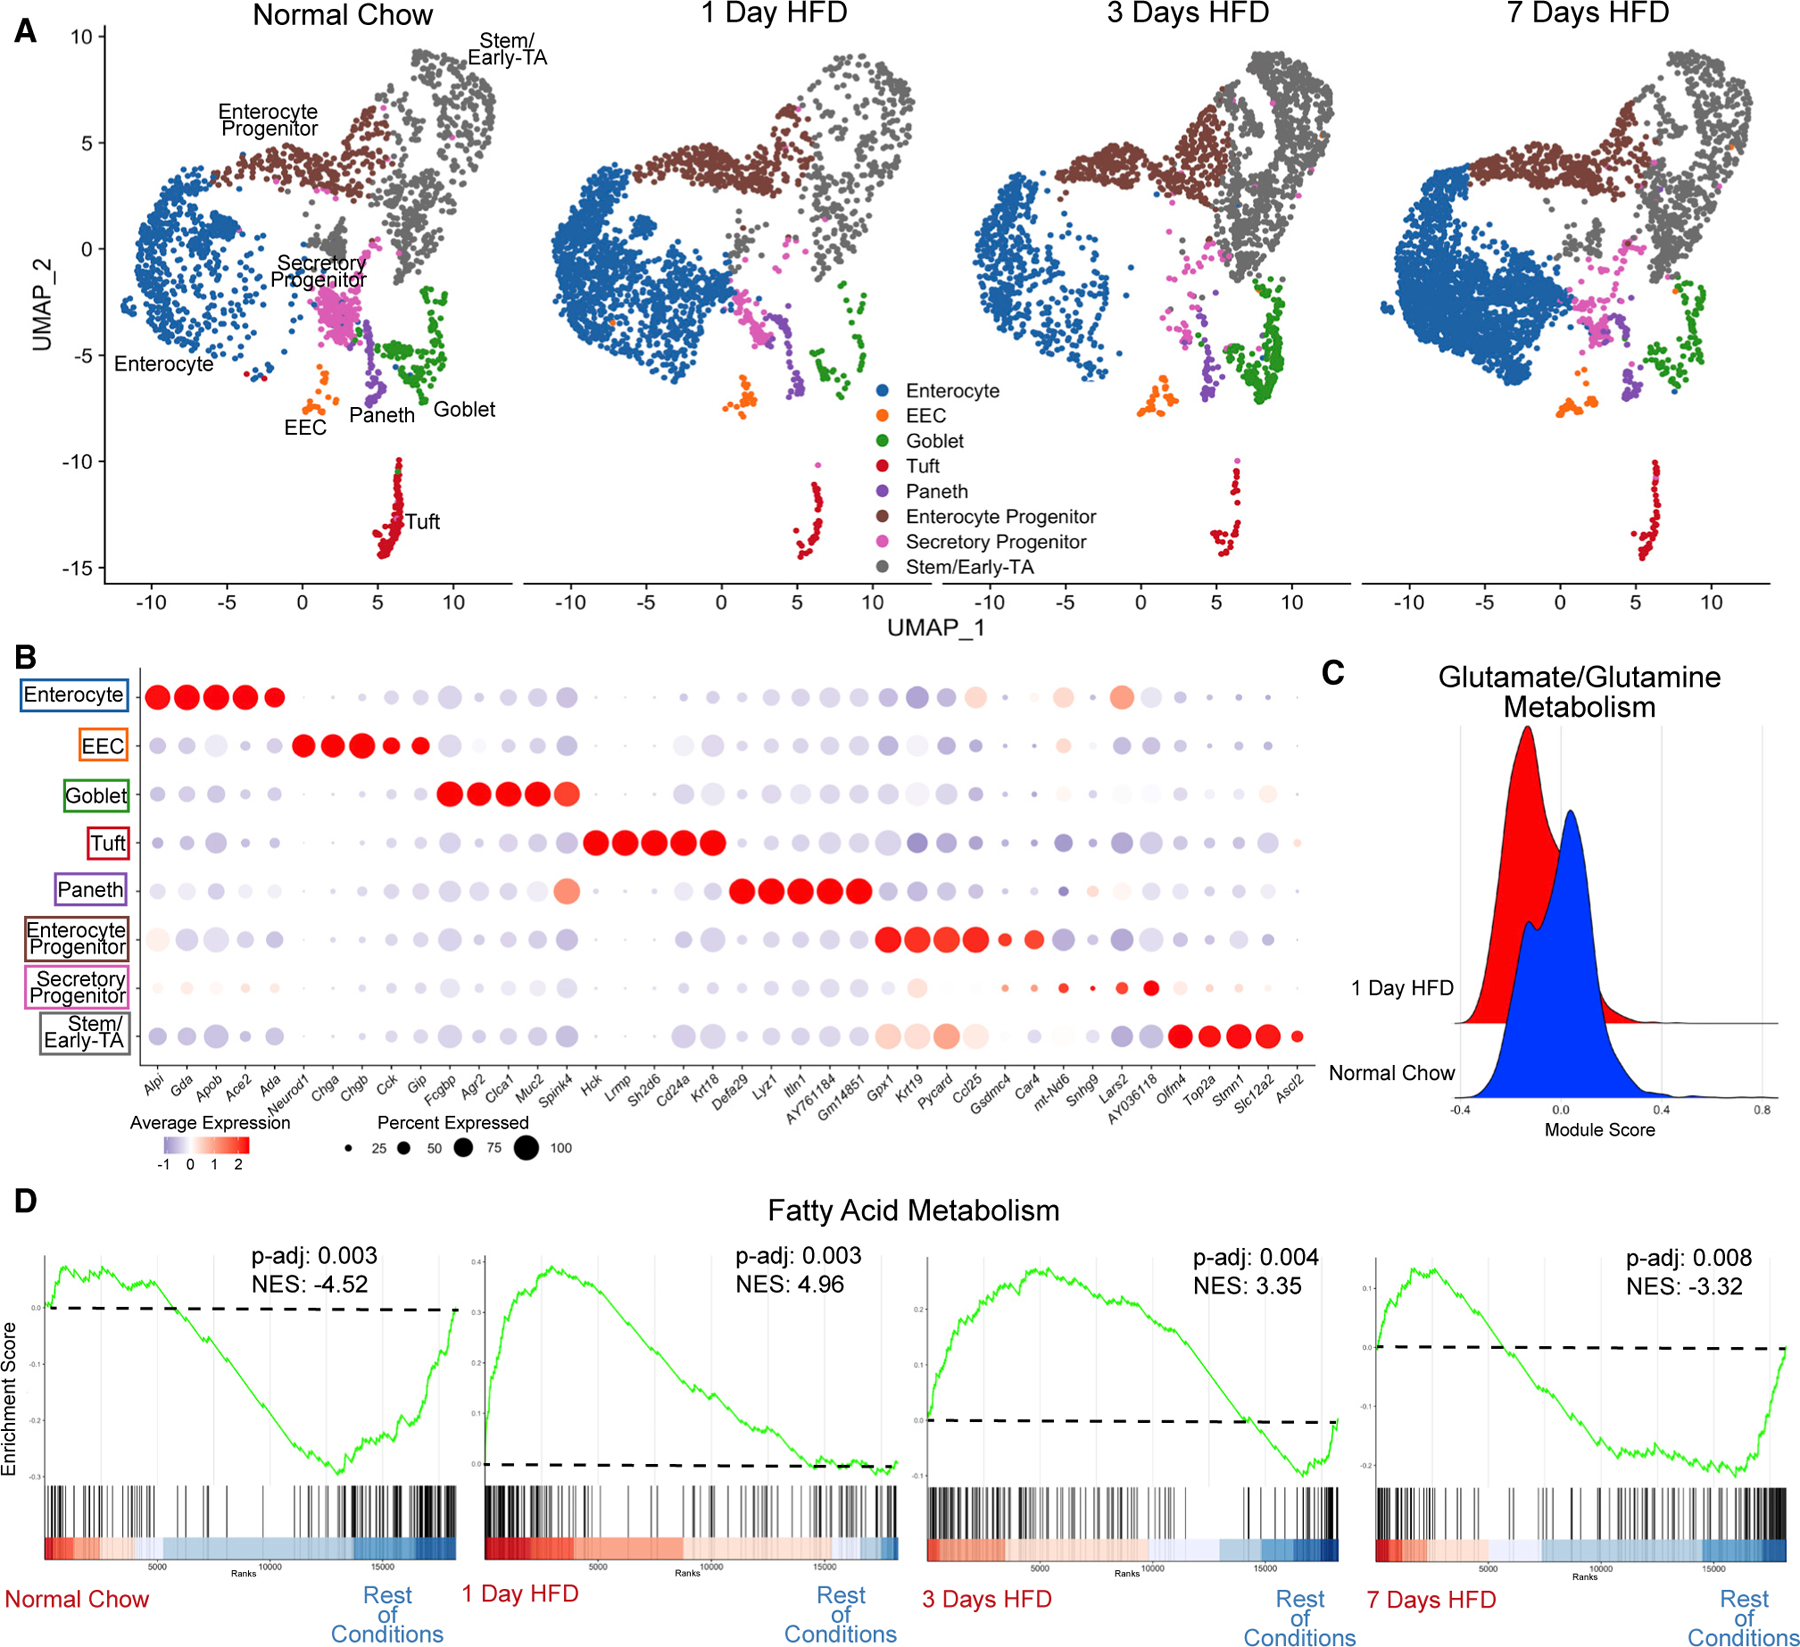
Figure 2. HFD initiates a rapid increase in expression of genes regulating fatty acid metabolism.

(A) Integrated analysis of jejunal epithelial sorted dataset: normal chow (reference dataset for integration, 2,214 cells), 1 day of HFD (2,309 cells), 3 days of HFD (2,353 cells), and 7 days of HFD (3,717 cells).
(B) Average dot plot expression of top 5 genes per cluster.
(C) Ridge plot between normal chow and 1 day of HFD depicting module gene score calculated for glutamate/glutamine metabolism.
(D) Gene set enrichment analysis (GSEA) using all clusters focusing on Hallmark fatty acid metabolism genes compared between each dietary condition. Green line denotes enrichment score for each cell per condition. Dashed line marks score at 0.0. Black lines above color gradient denote localization of Hallmark fatty acid metabolism genes. Blue (low) to red (high) color gradient depicts enrichment score expression. Adjusted p value (p-adj) and normalized enrichment score (NES) are reported in panel.
