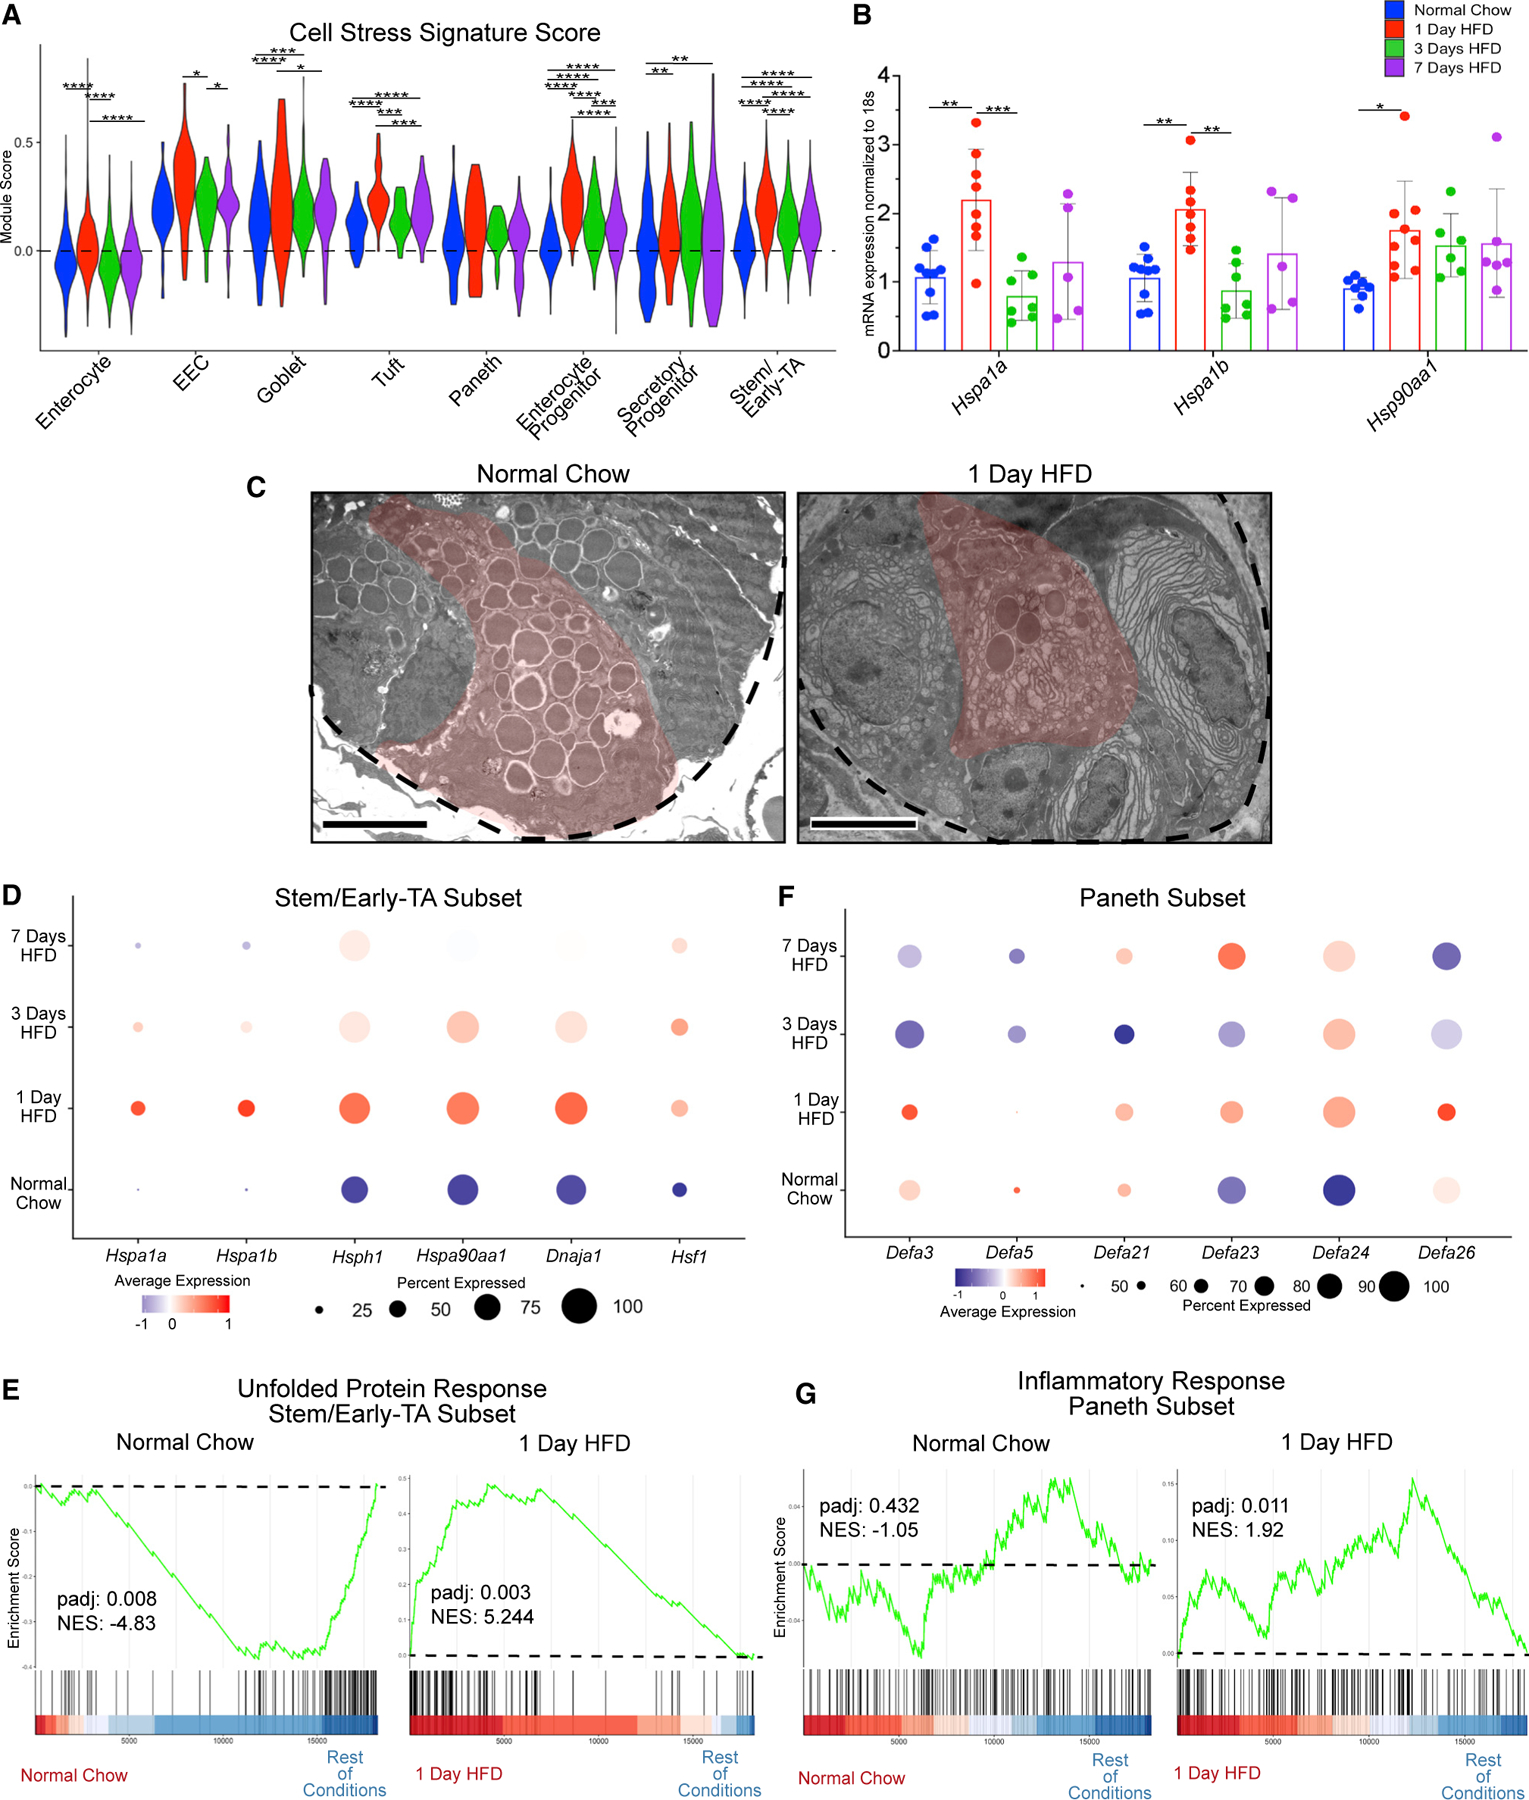
Figure 3. HFD triggers an immediate stress response.

(A) Cell stress module gene scores between dietary conditions in enterocyte, enteroendocrine (EEC), goblet, tuft, Paneth, enterocyte progenitor, secretory progenitor, and stem/early-TA clusters.
(B) qRT-PCR between dietary conditions for heat-shock protein 1A (Hspa1a), Hspa1b, and heat-shock protein 90, alpha (cytosolic), class A member 1 (Hsp90aa1). n = 5–9 mice.
(C) Transmission electron microscopy (TEM) images of crypts from animals fed normal chow and 1 day of HFD. Dashed line outlines the bottom of the crypt, while the red-pseudocolor denotes a representative Paneth cell. Scale bars: 4 μm.
(D) Dot plot depicting average gene expression of heat-shock-related genes in stem/early-TA zone cells.
(E) GSEA of Hallmark unfolded protein response genes comparing stem/early-TA zone cells between normal chow and 1 day of HFD.
(F) Dot plot depicting average gene expression of genes involved in defensin regulation in Paneth cells.
(G) GSEA of Hallmark inflammatory response genes comparing Paneth cells between normal chow and 1 day of HFD. Green line denotes enrichment score for each cell per condition. Dashed line marks score at 0.0. Black lines above color gradient denotes localization of Hallmark genes. Blue (low) to red (high) color gradient depicts enrichment score expression.
