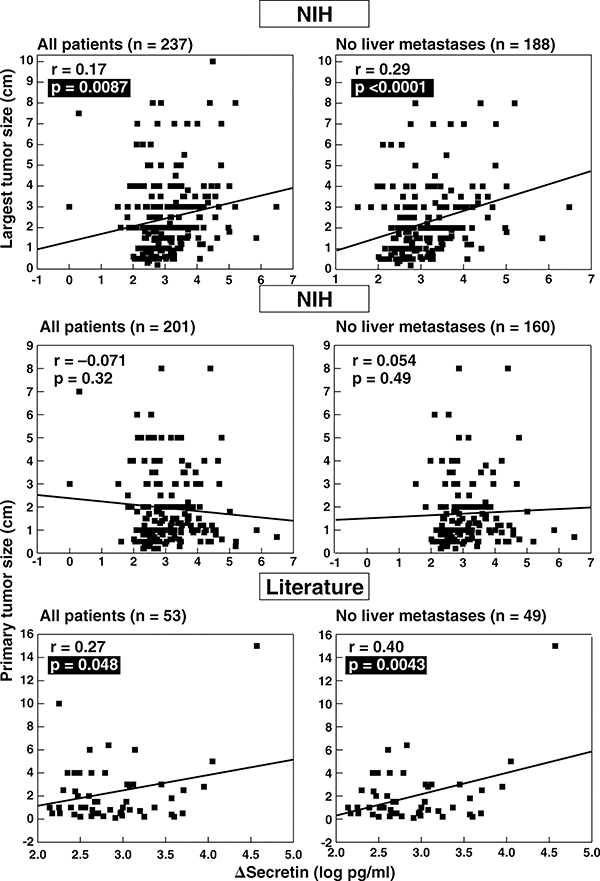
Figure 4.
Correlation between tumor size and secretin test results in ZES patients. The top panels show the correlation between the size of the largest tumor found at surgery or by imaging and the absolute change in serum gastrin after secretin injection (Δ secretin) in ZES patients from the NIH with and without liver metastases. The Δ secretin is expressed as the log of the change is serum gastrin with secretin. The middle and bottom panels show correlations of primary tumor size in ZES patients from NIH and from the literature with the Δ secretin. Each point represents data from one patient. Indicated are the regression line and the correlation coefficient (r) using a least-squares analysis. Literature data are from publications listed in Table 2. Tumor size is expressed as cm in diameter.

