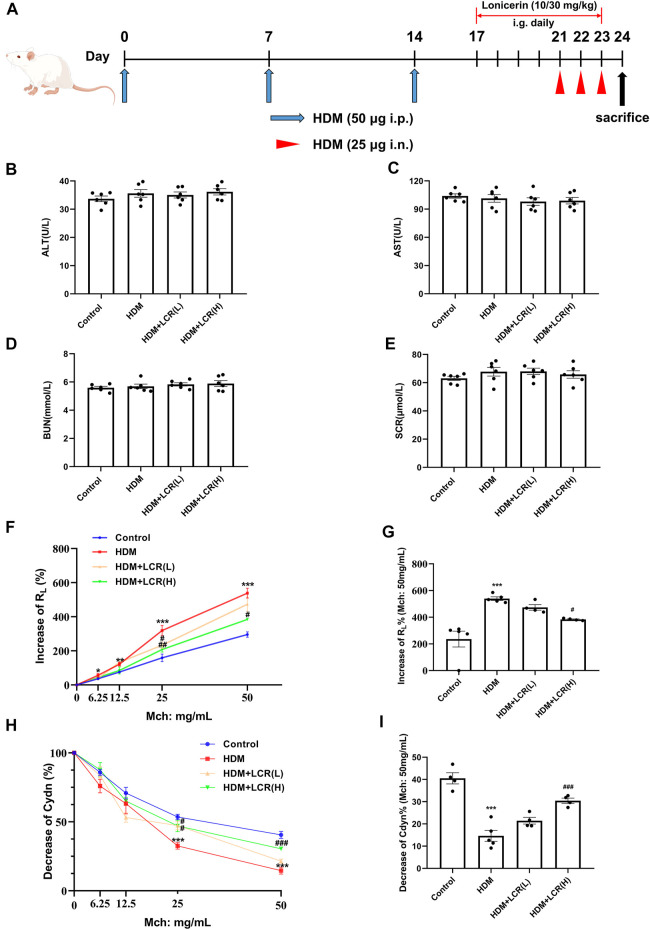
FIGURE 2.
Effects of lonicerin on liver and kidney function and AHR in a mouse model of HDM-induced eosinophilic asthma. (A) Asthma model establishment and treatment protocol as described in Materials and Methods. (B–E) the levels of AST, ALT, BUN and SCR in serum detected by Automatic Biochemistry Analyzer. (n = 6). (F) Increase of RL%. (G) Changes in RL to 50 mg/ml of Mch dose. (H) Decrease of Cdyn%. (I) Changes in Cdyn to 50 mg/ml of Mch dose. (n = 4–5). Data are expressed as mean ± SEM. Differences between groups were determined with one‐way ANOVA followed by the Tukey’s post hoc test. *p < 0.05, **p < 0.01, ***p < 0.001 vs. Control group; #p < 0.05, ##p < 0.01, ###p < 0.001 vs. HDM group.

