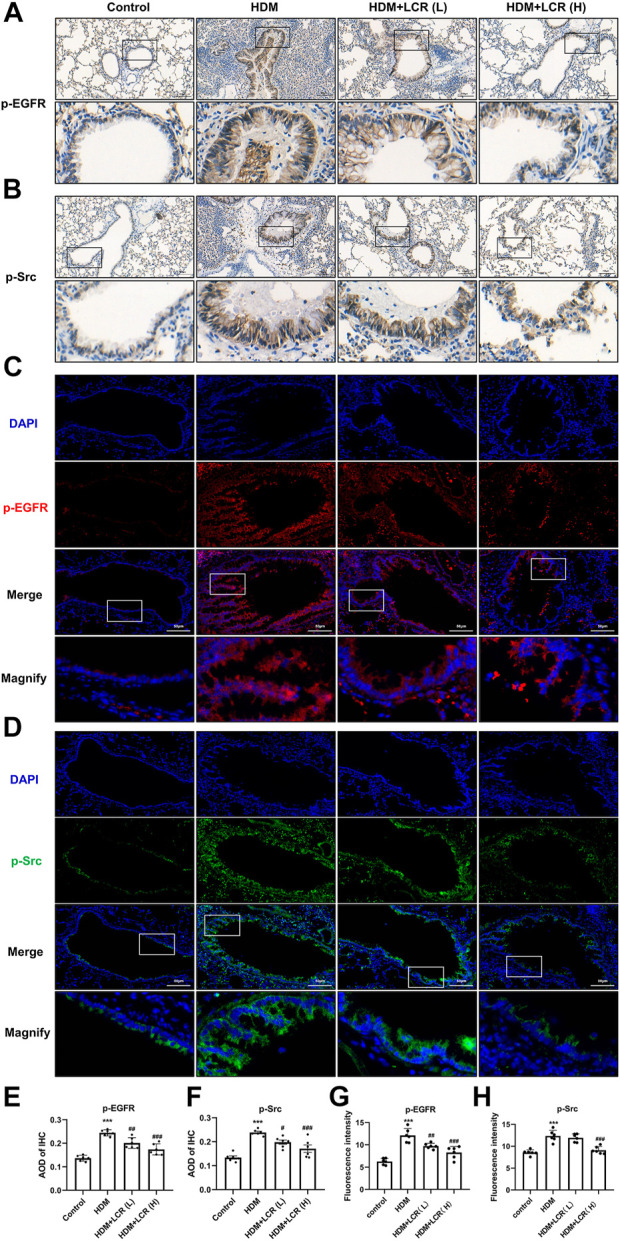
FIGURE 8.

Effects of lonicerin on the immunohistochemistry and immunofluorescence staining of p-EGFR and p-Src. (A,B) Immunohistochemical staining of mice lungs for p-Src and p-EGFR. (scale bar, 100 µm). (C,D) Immunofluorescent detection of p-Src and p-EGFR in lung sections, p-EGFR was visualized in red, p-Src was visualized in green, and DAPI-stained nuclei was in blue. (scale bar, 50 µm). (E,F) Quantitative analysis of immunohistochemical staining for p-Src and p-EGFR by AOD. (G,H) Quantitative analysis of immunofluorescence staining for p-Src and p-EGFR by fluorescence intensity. (n = 6). Data are expressed as mean ± SEM. Differences between groups were determined with one‐way ANOVA followed by the Tukey’s post hoc test. *p < 0.05, **p < 0.01, ***p < 0.001 vs. Control group; #p < 0.05, ##p < 0.01, ###p < 0.001 vs. HDM group.
