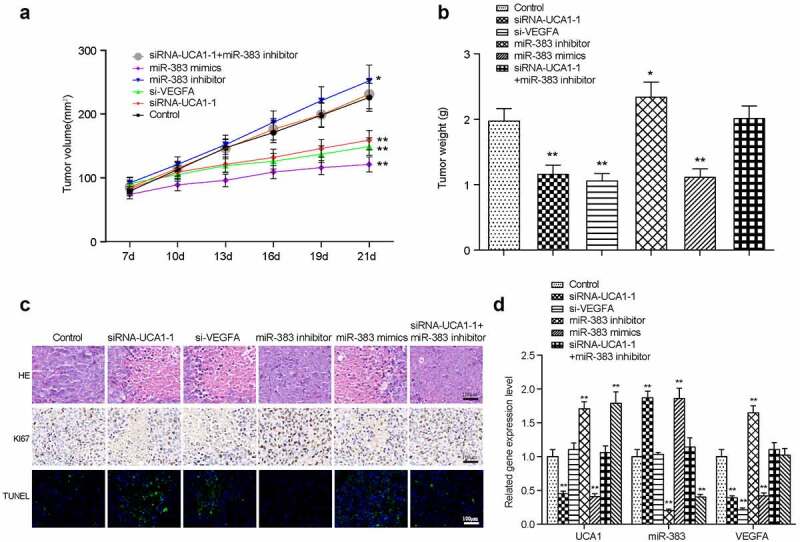
Figure 8.

Xenograft mice model assay. the linear graph exhibited the tumor volumes in different groups (miR-383 inhibitor, miR-383 mimics, siRna1+mir-383 inhibitor, si-VEGFA, siRNA1, Control). (b) Tumors weight in groups mentioned above. (c) HE staining, KI67 staining and TUNEL staining in tumor tissues of each treatment group. (d) The comprehensive study of the gene expression levels of lncRNA-UCA1, miR-383 and VEGFA in mice tumor tissues. N = 5, *P < 0.05, ** P < 0.01 comparison with Control group.
