FIGURE 3.
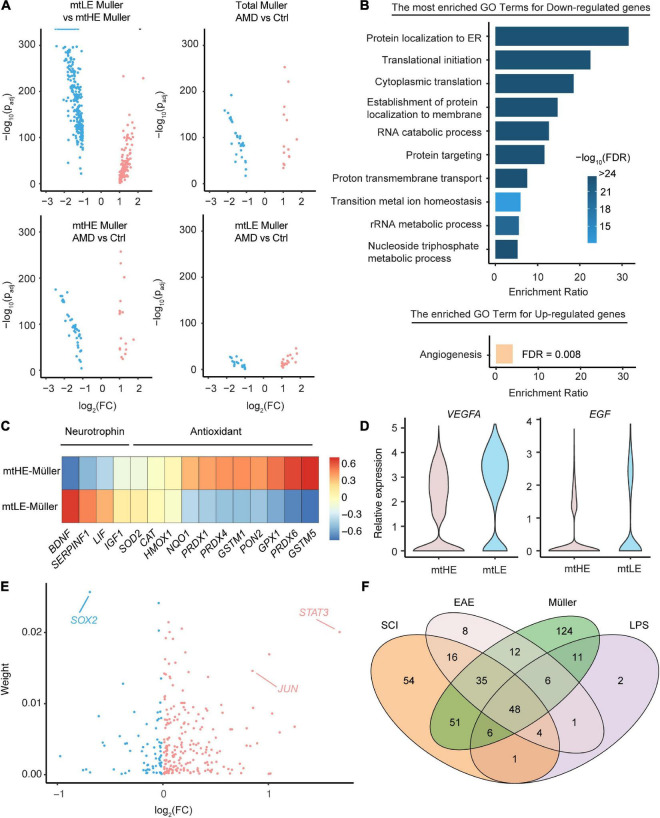
The functional diversity and regulatory networks of Müller cells with distinct metabolic-mitochondrial signatures. (A) The differential expression analysis enriched key DEGs under four comparison conditions. (B) The go-term analysis highlights the repressed protein synthesis in low expression of mtDNA (mtLE) Müller cells. Only the DEGs enriched by the comparison between mtLE and mtHE subpopulations [shown in the upper-left part of panel (A)] are processed in this analysis. (C) The mtLE Müller cells produce less antioxidant but more neurotrophin, compared with high expression of mtDNA (mtHE) subpopulation. (D) The expressions of VEGFA and EGF are upregulated in mtLE Müller cells. (E) The regulatory TFs controlling the expression profiles of mtLE and mtHE Müller cells are predicted. “Weight” indicates the estimated contribution of each TF and the x-axis is the fold change between mtLE and mtHE subpopulations. (F) The overlapping of regulators enriched from Müller cells and astrocytes under different conditions. SCI, spinal cord injury; EAE, experimental autoimmune encephalomyelitis; LPS, lipopolysaccharide.

