. 2022 Nov 29;11:e79903. doi: 10.7554/eLife.79903

Figure 1. Fixation can change the apparent liquid–liquid phase separation (LLPS) behaviors of proteins.

(A) EGFP-EWS(IDR), (B) EGFP-FUS(IDR), and (C) EGFP-TAF15(IDR) are transiently expressed in U2OS cells and imaged before and after fixation using confocal fluorescence microscopy. A schematic of each protein construct is shown on the left. A maximum z-projection of a representative live cell expressing its respective protein is shown next to that of the same cell after 10 min of fixation with 4% paraformaldehyde (PFA). The inserts show a zoomed-in region of the cell. (D–F) Quantification of percentage change of LLPS parameters after fixation. The values are averaged from 34 (D), 17 (E), or 24 (F) cells measured in 3 (D), 2 (E), or 2 (F) independent transfection and imaging sessions. Error bars represent standard errors. Asterisks indicate a significant difference compared with 0 (p<0.05, Wilcoxon signed-rank test).

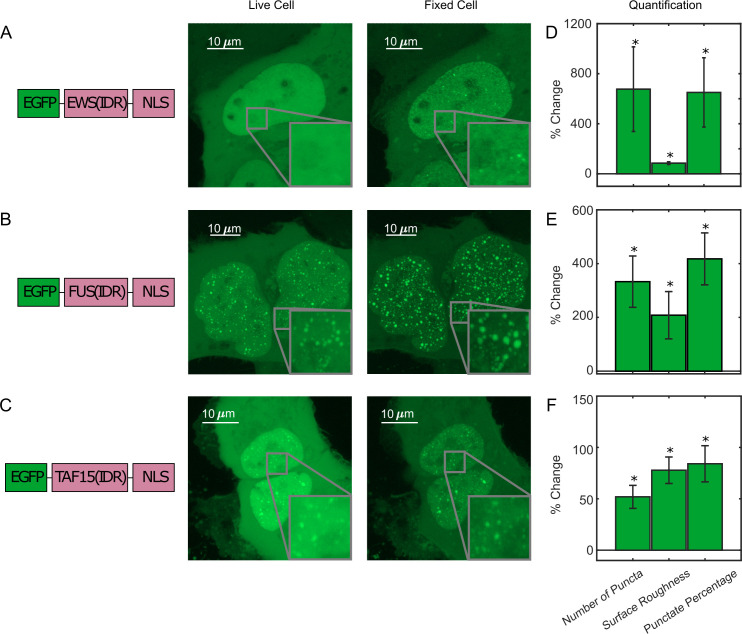
Figure 1—source data 1. Quantification of puncta parameters used to generate the bar plots.

Figure 1.

Figure 1—figure supplement 1. EGFP-EWS(IDR) can form droplet-like puncta in living cells, which change appearance upon fixation.

Figure 1—figure supplement 1.

The expression level of EGFP-EWS(IDR) here is significantly higher than in Figure 1A. After paraformaldehyde (PFA) fixation, additional puncta appear, and pre-existing puncta get bigger and brighter relative to the nucleoplasm, consistent with the trend shown in Figure 1A.
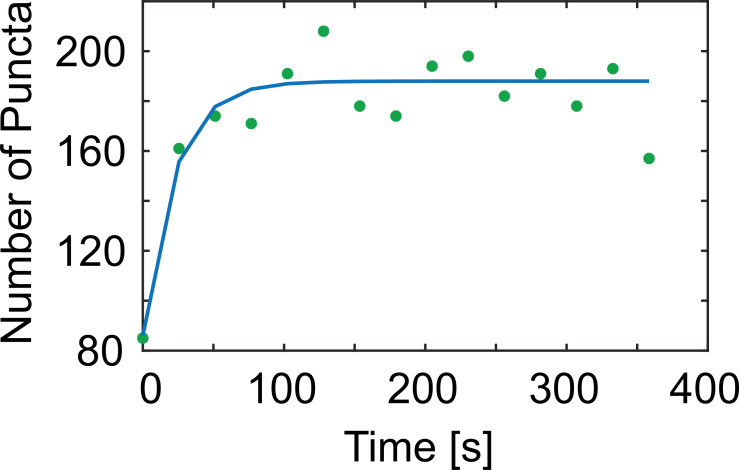
Figure 1—figure supplement 2. Quantification of Video 1 shows the number of EGFP-FUS(IDR) puncta in the cell as a function of the length of paraformaldehyde (PFA) treatment.

Figure 1—figure supplement 2.

Fixation is complete in ~100 s. The green scattered plot represents actual data points, and the blue line plot is to guide the eye.
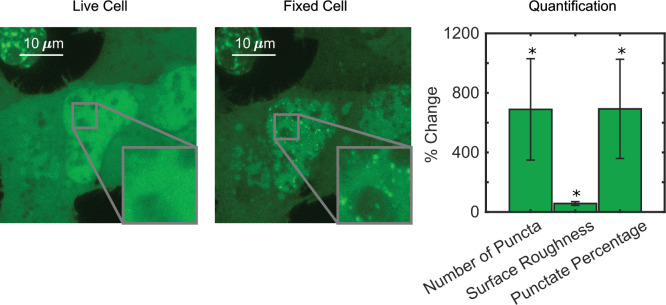
Figure 1—figure supplement 3. Fixation at various paraformaldehyde (PFA) concentrations can change the apparent liquid–liquid phase separation (LLPS) behaviors of EGFP-EWS(IDR).

Figure 1—figure supplement 3.

We show the percentage change of LLPS parameters after 10 min of fixation. The values are averaged from 10 (0% PFA, PBS buffer only), 20 (1% PFA), 20 (2% PFA), 34 (4% PFA), or 20 (8% PFA) cells. Error bars represent standard errors. Asterisks indicate a significant difference of the values compared with 0 (p<0.05, Wilcoxon signed-rank test). All the tested concentrations of PFA except for 0% PFA (PBS only) result in a significant change of the LLPS parameters. A quantitative comparison between the results at different PFA concentrations is difficult due to increased fluorescence quenching effects at higher concentrations of PFA. We thus focus on comparing the percentage change of LLPS parameters with 0 and with that upon treatment of PBS only.
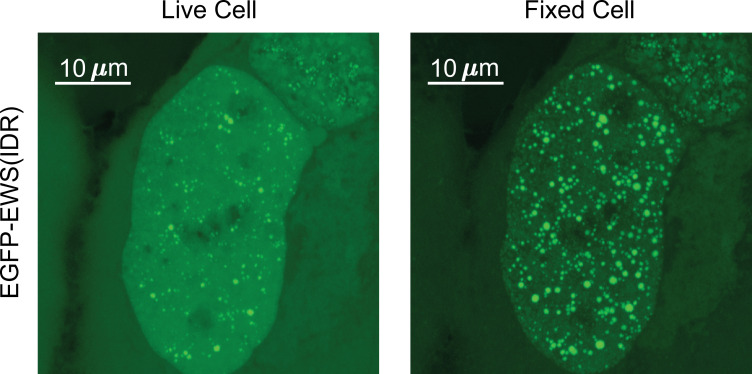
Figure 1—figure supplement 3—source data 1. Quantification of puncta parameters used to generate Figure 1—figure supplements 3 and 4.
Figure 1—figure supplement 4. Fixation using paraformaldehyde/glutaraldehyde (PFA/GA) in combination still changes the apparent liquid–liquid phase separation (LLPS) behaviors of EGFP-EWS(IDR).

Figure 1—figure supplement 4.

Adding 0.2% GA to 4% PFA does not reduce the fixation artifact. The fixed-cell image was taken 10 min after PFA/GA treatment. Percentage change of LLPS parameters after PFA/GA fixation is significantly different from 0, but not significantly different from the percentage change upon PFA only fixation (Figure 1D). The values here are averaged from 20 cells measured in one transfection and imaging session. Error bars represent standard errors. Asterisks indicate a significant difference compared with 0 (p<0.05, Wilcoxon signed-rank test).