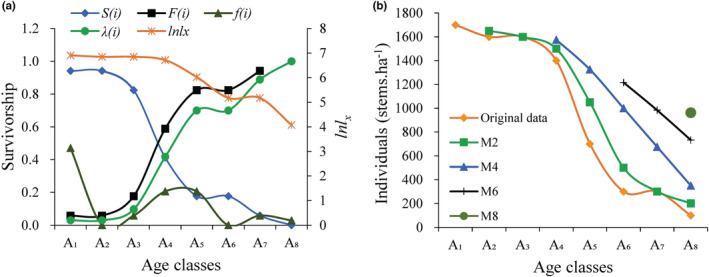
FIGURE 5.

The survival rate, cumulative mortality rate, mortality density rate and hazard rate function curves (a), and the time sequence prediction (b) of Cydonia oblonga population. X represents the age classes which are divided into class A1, A2, A3, A4, A5, A6, A7, and A8 according to the basal diameter class; A x , survival number; l x , standardized survival number; d x , death number; q x , standardized mortality rate; L x , span life; T x , total life; e x , life expectancy; K x , the disappearance rate; S x , the survival rate. Using the time sequence model, the population developmental trend in the next A2 (M2), A4 (M4), A6 (M6), and A8 (M8) age classes were predicted.
