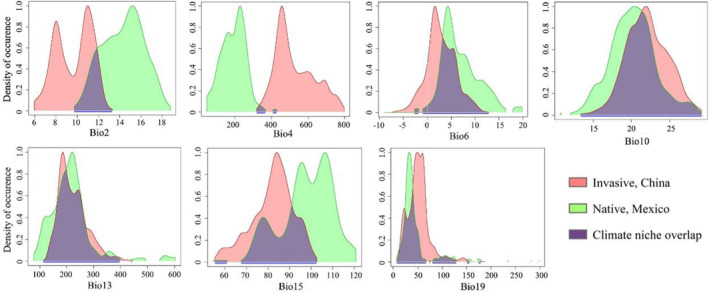
FIGURE 5.

Predicted niche occupancy profiles. Bio2: Mean diurnal range. Bio4: Temperature seasonality (standard deviation ×100). Bio6: Minimum temperature of the coldest month. Bio10: Mean temperature of the warmest quarter. Bio13: Precipitation of the wettest month. Bio15: Precipitation seasonality (coefficient of variation). Bio19: Precipitation of the coldest quarter.
