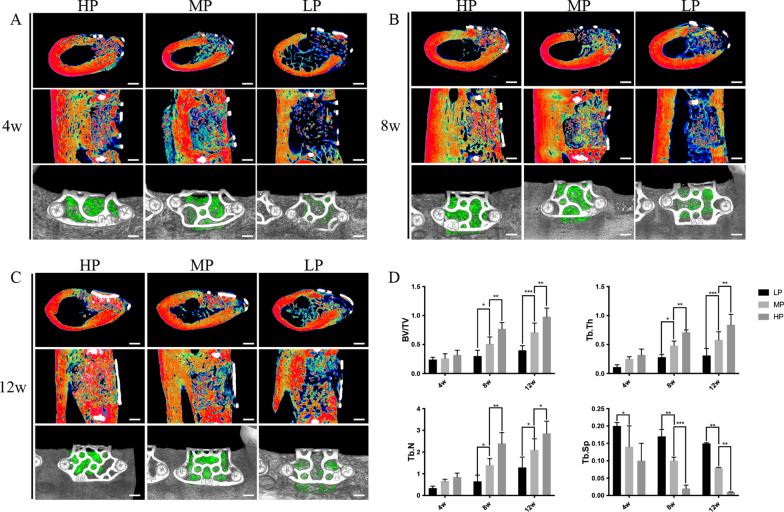
Fig. 3.
Micro-CT image results of the repair effect of different titanium meshes on bone defects. A After 4 weeks, the bone defect area can be observed in the coronal and sagittal positions. In the HP group, mixed masses of old and new bone with low density are observed. In the MP group, old bone and fibrous tissue are noted. In the LP group, old bone particles left in the bone defect area are observed. After three-dimensional reconstruction, the volume of the new bone was larger in the HP group followed by MP and LP groups; B After 8 weeks, the bone defect area in each group was repaired to a certain extent compared with that at 4 weeks. From the perspective of coronal, sagittal, and three-dimensional reconstruction, the new bone density and volume had the same pattern as that after 4 weeks; C After 12 weeks, the bone defect area in each group was further repaired compared with that at 8 weeks, especially in the HP group. The old and new bones were combined, as observed in the coronal and sagittal positions, filling the whole bone defect area; D Parameter analysis showed that Tb. Th, Tb. N, and BV/TV in each group increased with the increase of bone healing time, while Tb. SP decreased with the increase of bone healing time; thus, the new bone mineral density showed an upward trend. At each time point, Tb. TH, Tb. N, and BV/TV in the HP group were higher than those in the other two groups, and Tb. SP decreased slightly with time and was lower than that in the other two groups. In the MP group, BV/TV, Tb. TH, and Tb. N were higher than those in the LP group, while Tb. SP was lower than that in the LP group, and a statistical difference between them was observed. Scalebar = 1.5 mm

