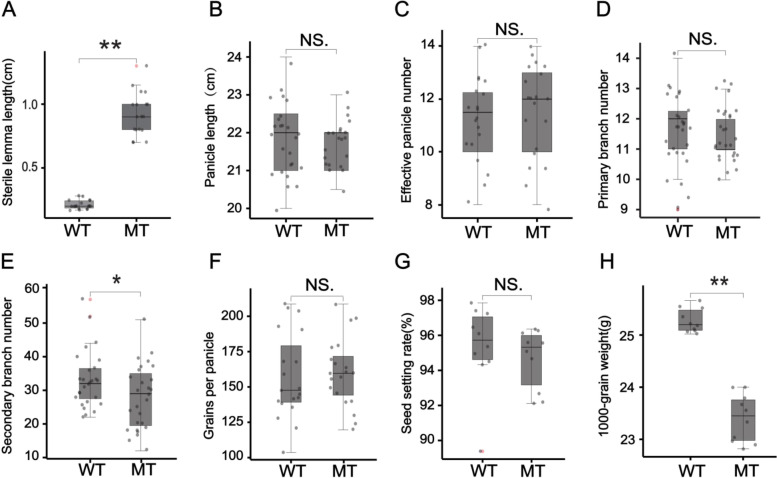
Fig. 2.
Box-and-whiskers comparison of yield-related traits between wild type (WT) and mutant (MT) with long, sterile lemmas. a Sterile lemma length. b Panicle length. c Effective panicle number. d Primary branch number. e Second branch number. f Grains per panicle. g Seed setting rate. h 1000-grain weight. A horizontal line in the middle of each box represents the median, and the upper and lower ends of each box represents the upper and lower quartiles, respectively. Each black dot represents a data point from the sample, whereas red dots represent the coordinates of any outliers. The whiskers indicate the minimum and maximum values, respectively. Two-tailed Student’s t-test was performed to determine the significance of any difference in each trait between wild type and mutant (NS, not significant;*, P < 0.05; **, P < 0.01)

