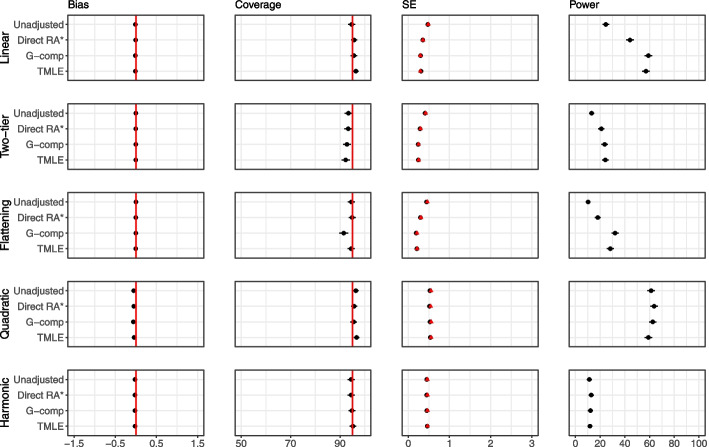
Fig. 10.
Extension 3 results (binary outcome, single covariate, no interaction) for sample size 100 and odds ratio as the estimand of interest. The performance of analytic methods in terms of bias, coverage and power is shown for the five different covariate–outcome relationships. Bias calculated for the marginal log-odds for all methods except for direct regression adjustment (RA). Model-based standard errors are shown in black and empirical standard errors are shown in red. The conditional odds ratio is 0.2. * For direct regression adjustment (RA), the bias is the difference between the estimated conditional odds ratio, and the data generating conditional odds ratio. The standard errors for direct RA cannot be compared to the other approaches

