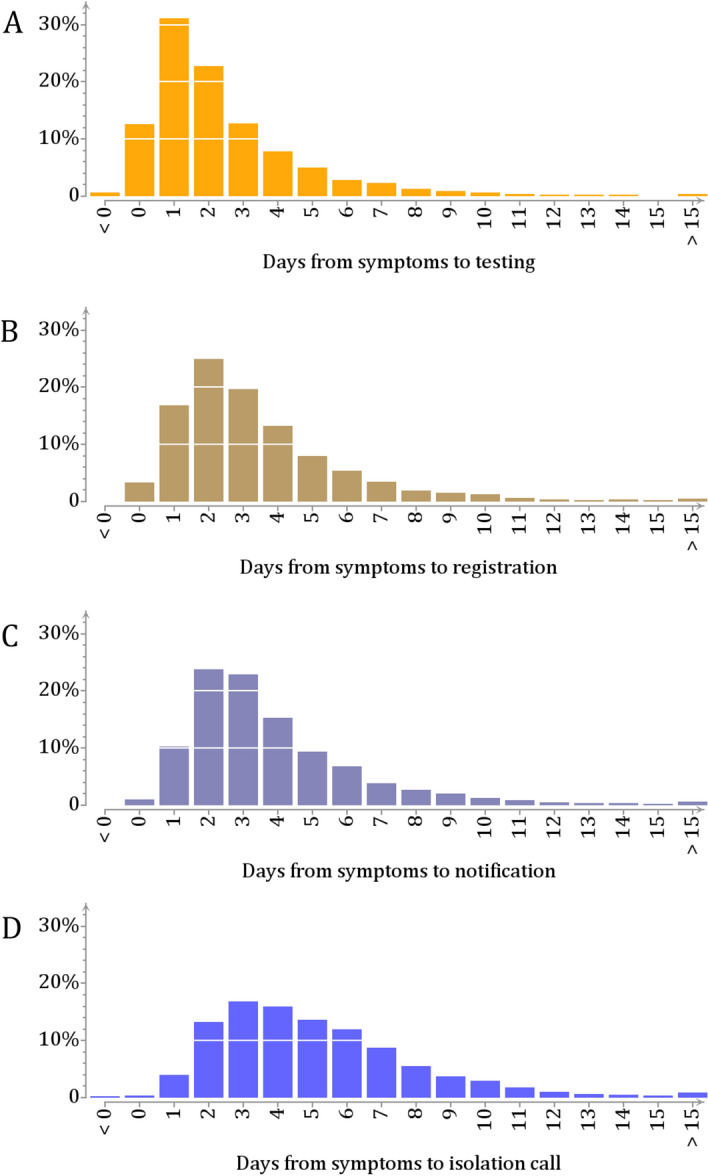
Figure 2.

Time lags in case isolation. Based on 4622 SARS-CoV-2 cases, the figure shows the distributions of the time lag in days from symptoms to (a) testing (mean 2.4 days; median 2 days; (b) registration (mean 3.3 days; median 3 days); (c) notification (mean 3.8 days; median 3 days); and (d) isolation call (mean 5.0 days; median 5 day). The corresponding cumulative distributions of the time lags are shown in Supplementary Fig. 1.
