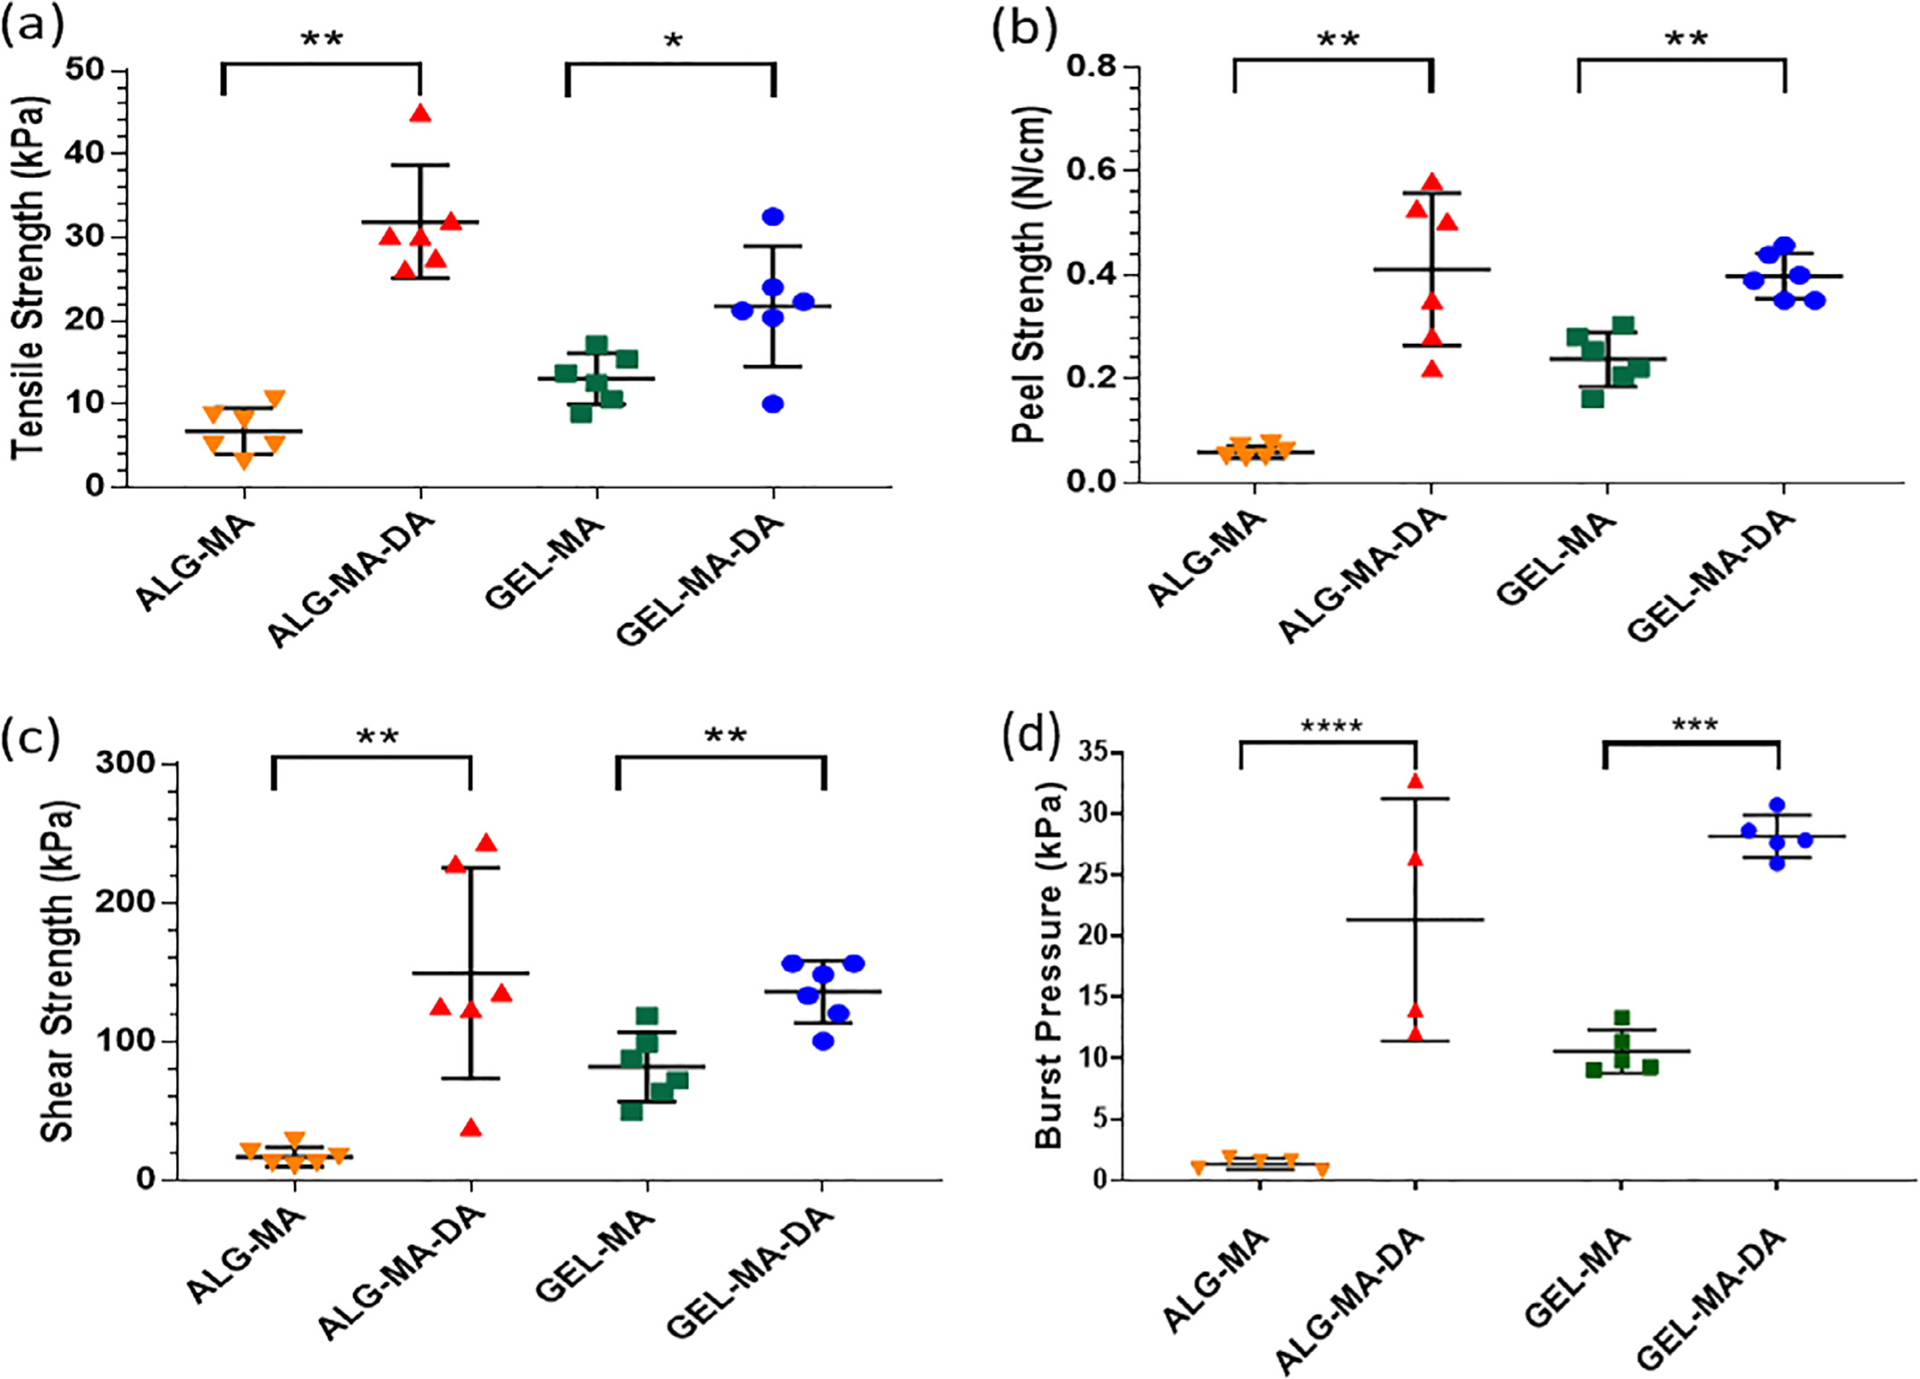
Fig. 4. Mechanical testing.

Patches of alginate derivatives and solutions of gelatin derivatives were used. (a) Tensile strength determined by tensile tests. Values represent mean ± standard deviation (SD, error bars) and n = 6. (b) Peel strength by T-peel tests. Values represent mean ± SD (error bars) and n = 6. (c) Shear strength by lap-shear tests. Values represent mean ± SD (error bars) and n = 6. (d) (d) Burst pressure versus time to burst (failure). Values represent mean ± SD (error bars) and n = 5. Values represent mean ± SD (error bars) of n = 4 from one of two representative experiments. * p < 0.05, ** p < 0.01, *** p = 0.0001, and **** p < 0.0001.
