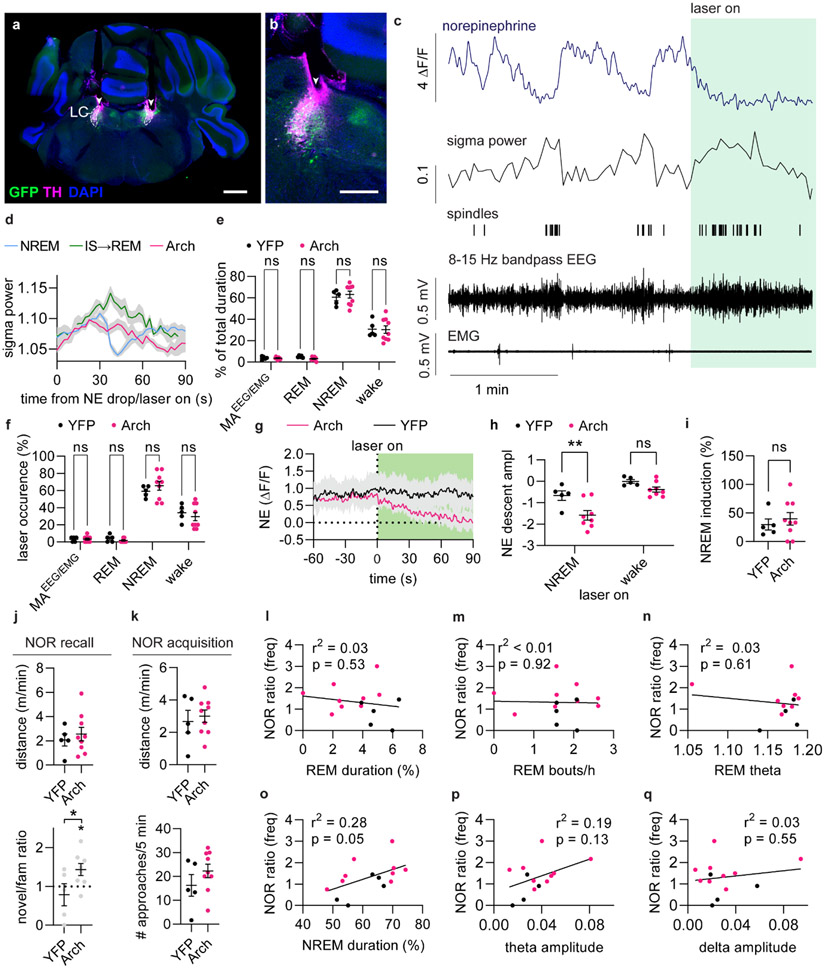
Extended Figure 4. Optogenetic suppression of LC.
a. Arch expression in LC was verified by co-staining for TH and GFP. Arrowheads indicate the tip location of the optic fiber (scale bar = 800 μm). b. Close up of a (scale bar = 400 μm). c. Example traces showing norepinephrine level, sigma power, sleep spindles, bandpass LFP in sigma range, and EMG raw data. d. Mean sigma power aligned to onset of NE drop (NREM and IS-REM) or onset of laser stimulation (Arch). e. Time spent in sleep/wake stages during 2 h recording between memory encoding and recall (2-way repeated measures ANOVA with Šídák’s multiple comparison post hoc test). f. Number of laser stimulation (% of total number) in each sleep/wake stage (2-way repeated measures ANOVA with Šídák’s multiple comparison post hoc test). g. Mean NE trace at laser onset during wakefulness. h. NE descent amplitude induced by laser onset during NREM and wakefulness (2-way repeated measures ANOVA with Šídák’s multiple comparison post hoc test, P = 0.0046, NRREM). i. Percentage of laser stimulations during wakefulness resulting in transition to NREM sleep (unpaired t-test). j. Distance moved and ratio between approaches during the recall phase of the novel object recognition (NOR) (two-tailed unpaired t-test, P = 0.049, one-sample t-test P = 0.49, YFP; P = 0.026, Arch). k. Distance moved and object approaches during the acquisition phase of the NOR (unpaired t-test). l. Linear regression between object exploration ratio and time spent in REM sleep. m. Linear regression between object exploration ratio and number of REM bouts/h. n. Linear regression between object exploration ratio and mean theta power during REM sleep. o. Linear regression between object exploration ratio and time spent in NREM sleep. p. Linear regression between object exploration ratio and theta amplitude in response to laser. q. Linear regression between object exploration ratio and delta amplitude in response to laser. n = 9 Arch, 5 YFP. Data is shown as mean±SEM. *p < 0.05, **p < 0.01.

