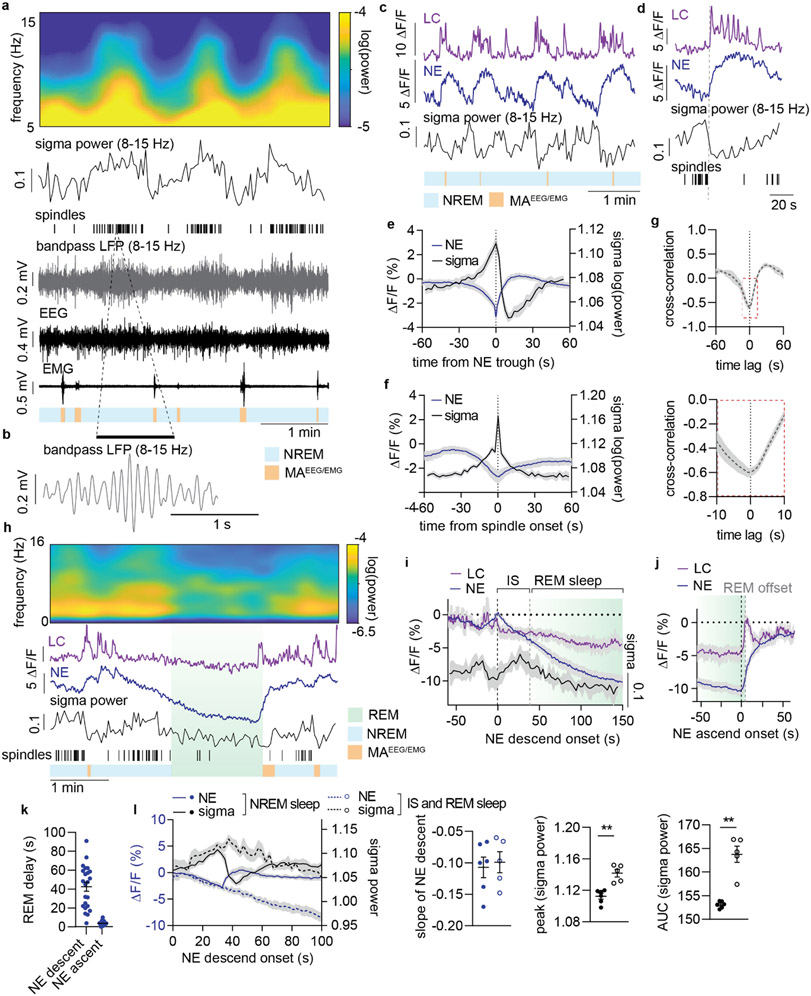
Figure 2. Prolonged NE descent promotes spindle-rich IS and REM sleep transitions.
a. Representative simultaneous surface EEG and depth local field potential (LFP) recordings showing the correlation between LFP-based spindle detection and EEG-based sigma power. Displayed are EEG power spectrogram, EEG-based sigma power, LFP-based spindle occurrences, 8-15 Hz bandpass filtered LFP, raw EEG and EMG, and color-coded sleep phases. b. Zoom-in of 8-15 Hz bandpass filtered LFP showing a representative spindle. c. Representative traces from simultaneous measurements of locus coeruleus (LC) and norepinephrine (NE) during NREM sleep and their association with sigma power. d. Representative LC and NE traces as well as sigma power and spindle occurrences upon NE ascent. e. Mean NE and sigma power traces aligned to NE trough during NREM sleep. f. Mean NE and sigma power traces aligned to spindle onset during NREM sleep. g. Cross-correlation between sigma power and NE level based on 10 min NREM sleep epochs. Bottom: zoom-in to illustrate time lag. h. Representative recordings covering REM sleep transitions (REM sleep>150 s in duration) showing EEG power spectrogram, LC and NE traces, sigma power, spindle occurrences and color-coded sleep phases. i. Mean LC and NE activity, and sigma power from NE descent onset preceding REM onset. Mean onset of REM sleep is displayed . The period from NE descent onset until REM sleep onset is marked as intermediate state (IS) sleep. j. Mean LC and NE activity during REM sleep aligned to the onset of NE ascent preceding REM sleep offset. Mean REM sleep offset is marked. k. Mean delay from NE descent onset to REM sleep onset and from NE ascent to REM sleep offset (23 REM sleep occurrences across n = 5). l. Mean NE and sigma power during NREM sleep versus IS-REM sleep from the onset of NE descent; slope of NE descent for NREM and IS sleep (two-tailed, paired t-test; P = 0.89); increase in sigma power peak (two-tailed, paired t-test; P = 0.006) and area under the curve (AUC) (two-tailed, paired t-test; P = 0.005) NREM and IS-REM sleep. Significance was calculated by means of paired t-test. n = 6 (NREM); n = 5 (IS-REM). Data is shown as mean±SEM. **P< 0.01.

