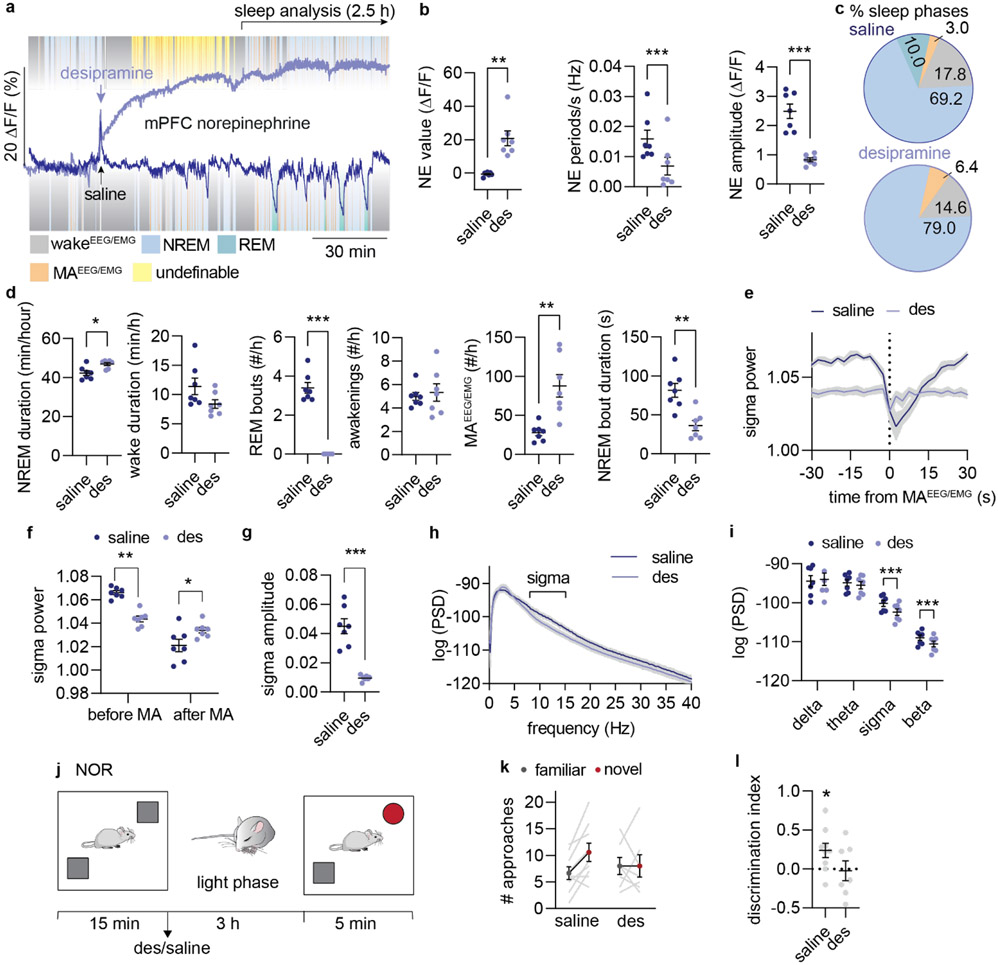
Figure 5. Pharmacological reduction of NE amplitude promotes micro-arousal and compromises memory.
a. Mice were administered with saline or desipramine (des, 10 mg/kg, i.p.) during the light phase and allowed to sleep for 3.5 hrs. 3 days after, treatment was reversed. Analysis was done on 1-3.5 h period after administration. b. Effect of desipramine on mean NE value (two-tailed paired t-test, P = 0.0026), NE oscillation frequency (two-tailed paired t-test, P = 0.0004), and NE amplitude during NREM sleep (two-tailed paired t-test, P = 0.0003). c. Mean distribution of % time spent in NREM sleep, REM sleep, wakefulness and micro-arousals. d. Time spent in NREM sleep (two-tailed paired t-test, P = 0.030) and wake (two-tailed paired t-test, P = 0.64), number of REM bouts (two-tailed paired t-test, P < 0.0001), wake bouts (two-tailed paired t-test, P = 0.70), micro-arousals (two-tailed paired t-test, P = 0.0041), and mean duration of NREM sleep bouts (two tailed paired t-test, P = 0.0029). e. Mean sigma power traces aligned to NREM-to-MAEEG/EMG transition. F. Mean sigma power before and after NREM-to-MAEEG/EMG transition (2-way repeated measures ANOVA with Šídák’s multiple comparison post hoc test, P = 0.0024, before; P = 0.031, after). g. Mean sigma power amplitude reduction across NREM-to-MAEEG/EMG transition (two-tailed paired t-test, P = 0.0007). h-i. Power spectral densities during NREM sleep and mean power spectral densities across frequency bands (2-way repeated measures ANOVA with Šídák’s multiple comparison post hoc test, P = 0.72, delta; P = 0.10, alpha; P = 0.0003, sigma; P < 0.0001, beta). j. In a separate experiment, mice were subjected to novel object recognition (NOR) during their light phase and administered with desipramine or saline immediately after the encoding phase. Mice were allowed to sleep for three hours before the recall phase. k. Number of approaches towards novel versus familiar object during recall . l. Discrimination index for novel versus familiar object (one-sample t-test, P = 0.032, saline; P = 0.86, des; two-tailed unpaired t-test, P = 0.11). n = 7 (a-i), n = 7 des, 9 saline (j-l). Data is shown as mean±SEM. *P< 0.05, **P< 0.01, ***P< 0.001.

