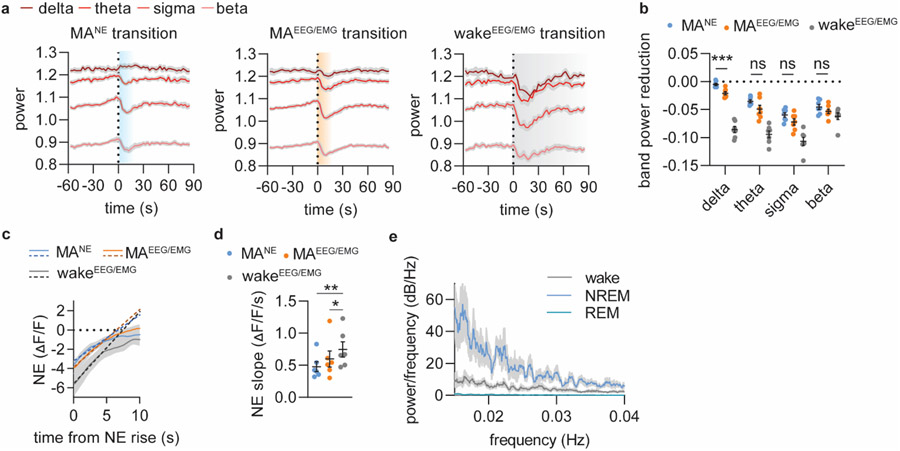
Extended Figure 1. All ascending stages of NE oscillations are associated with EEG-defined micro-arousals or awakenings.
a. Mean power traces for delta, theta, sigma and beta frequency bands aligned to NE rise associated with EEG/EMG-based transitions from NREM sleep to continued NREM sleep (blue, MANE), micro-arousals (MAEEG/EMG, orange) and wake (grey, wakeEEG/EMG). b. Summary plot showing the reduction in band power across the different transitions. There was no difference between MANE and MAEEG/EMG for theta, sigma and beta band power, which are the frequencies used to assess micro-arousals. Significance was calculated by means of two-way repeated measures ANOVA with Šídák’s post hoc test (only MANE and MAEEG/EMG post hoc comparisons shown in graph for simplicity, P = 0.0003, delta; P = 0.13, theta; P = 0.11, sigma; P = 0.65, beta). c. Slope of linear regression on 5 initial seconds of NE rise was used as estimate for rise time. d. NE slope across the different type of transitions (repeated measures one-way ANOVA with Tukey's multiple comparisons test, P = 0.0059, MANE vs wake; P = 0.041, MAEEG/EMG vs wake). e. Multi-taper power spectral analysis showed increased power for slower frequencies for NREM sleep compared to wake and REM sleep with no defined peak frequency likely due to the discrete nature of NE oscillations. n = 7. Data is shown as mean±SEM. ***p < 0.001.

