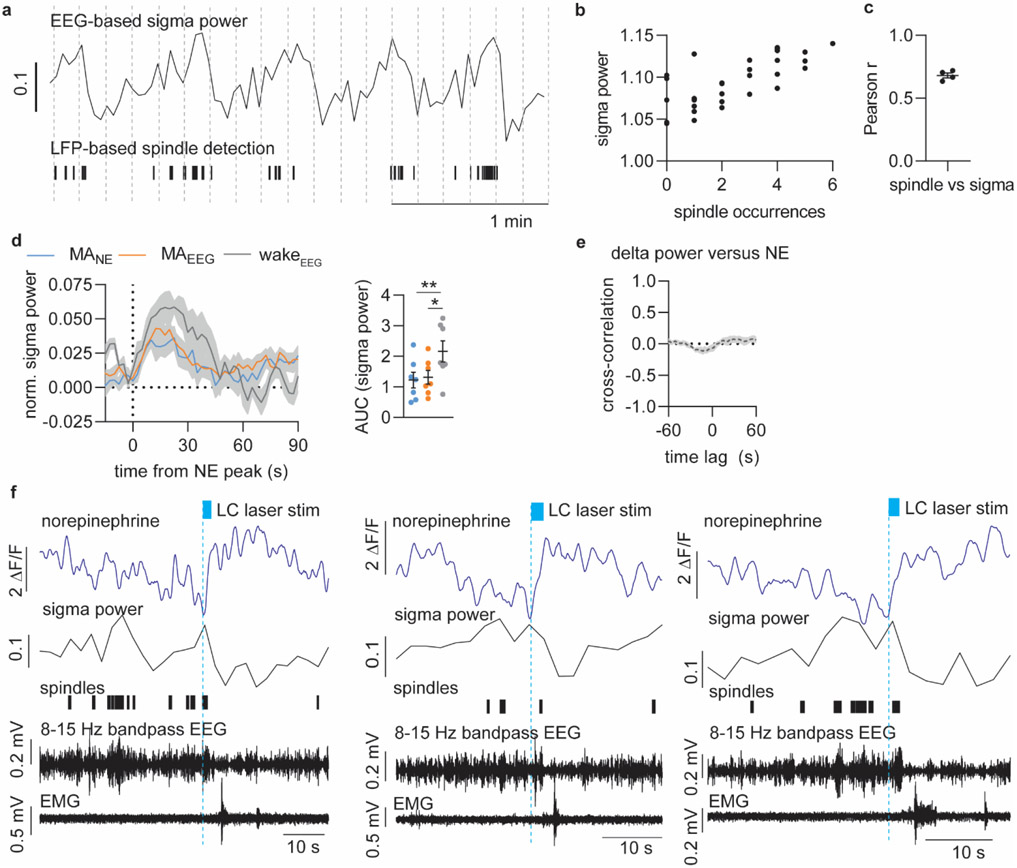
Extended Figure 3. Supplementary Figure S6. Relationship between norepinephrine, sigma power, spindles and delta power.
a. Representative trace showing sigma power of surface EEG recordings with corresponding detection of spindles based on S1 cortical LFP recordings. b. Correlation between spindle occurrences and mean sigma power across 10 s bins over a 5 min NREM sleep episode. c. Mean Pearson r values (0.63 +/− 0.02). d. Mean sigma power traces normalized to baseline showing the amount of sigma power increase associated with NE descents preceeding microarousals (MANE or MAEEG/EMG) or awakenings (wakeEEG/EMG). Calculated area under the curve (AUC) for sigma power is largest during the NE descents associated with awakenings transitions (two-tailed paired t-test; P = 0.60, MANE vs MAEEG/EMG; P = 0.0057, MANE vs wake; P = 0.044, MAEEG/EMG vs wake).e. Mean correlation coefficient between delta power and NE level (5 min NREM sleep episodes) f. Three different example traces showing how optogenetic activation of locus coeruleus (LC, 2 s 20 Hz 10 ms pulses) during periods of NE descend leads to NE ascend followed by a delayed change in spindle occurrences and amplitude reduction of 7-15 bandpass filtered EEG that is not represented by sigma power (window = 5 s, overlap: 2.5 s). n = 4 (c); n = 7 (d-e). Data is shown as mean±SEM. *p < 0.05, **p < 0.01.

