
Figure 2.
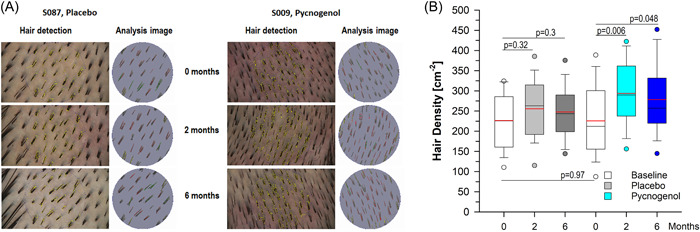
Results for hair density are shown (A) as epiluminescence microscopy (elm) photographs and the corresponding Trichoscan evaluations from representative examples of the placebo and the Pycnogenol® group at the beginning and after 2 and 6 months and (B) as box plots with median (black line) and mean (red line) for both groups obtaining either placebo (N = 30) or Pycnogenol® (N = 33) as indicated. The boundary of the box closest to zero indicates the 25th percentile, and the boundary of the box farthest from zero indicates the 75th percentile. Whiskers (error bars) above and below the box indicate the 95th and 5th percentiles. Circles reflect outliers. One way analysis of variance Student−Newman−Keuls (SNK, red line reflects mean), *p < 0.05 versus untreated.