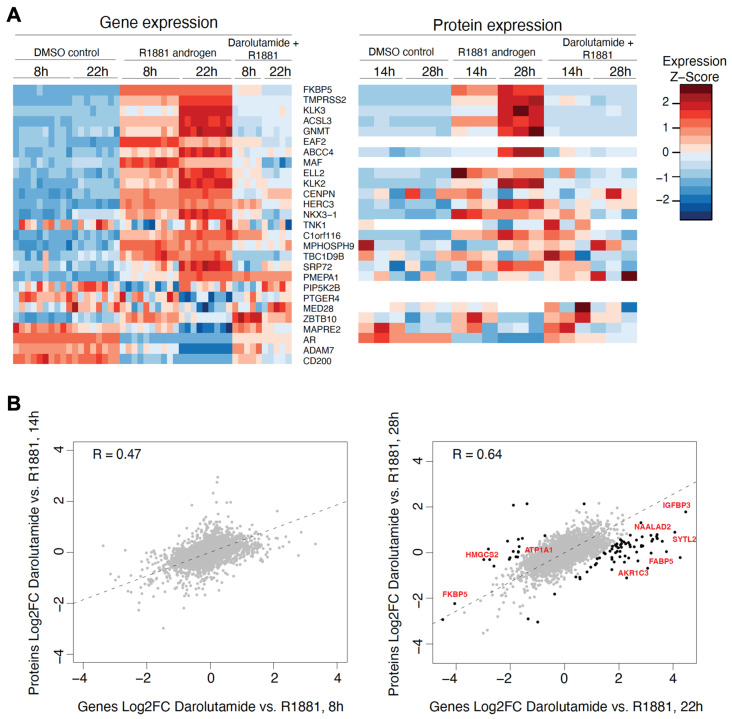
Figure 4.
(A) Heatmap plots of mRNA (left side) and protein (right side) levels of AR activity signature genes following treatment of VCaP cells with DMSO, R1881, or R1881 and darolutamide for the indicated times. (B) Scatterplots of Log2 fold changes in mRNA and protein abundance upon R1881 and darolutamide treatment compared to R1881 treatment alone. Gene expression after 8 h and protein level after 14 h of treatment was determined as early time point (left side). Gene expression after 22 h and protein level after 28 h of treatment was determined as late time point (right side). Genes with differential magnitude of response on the mRNA and protein levels are indicated in black, a few selected androgen targets are highlighted.

