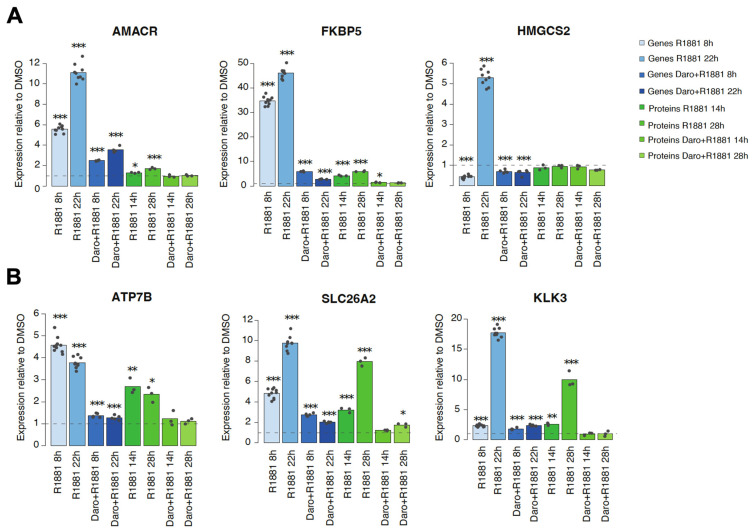
Figure 5.
Gene and protein expression changes upon androgen, or androgen and darolutamide treatment, relative to the corresponding DMSO control which was set to 1 (grey horizontal dotted line). Blue bars indicate expression of genes measured by RNA-seq, green bars indicate levels of proteins measured by tandem mass spectrometry. (A) Examples of genes with discordant changes in mRNA and protein levels. (B) Examples of genes with similar responses at the mRNA and protein levels. Stars indicate the false discovery rate (FDR) for comparison of the indicated condition to the corresponding DMSO control: *** p < 0.0001, ** p < 0.001, * p < 0.01.

