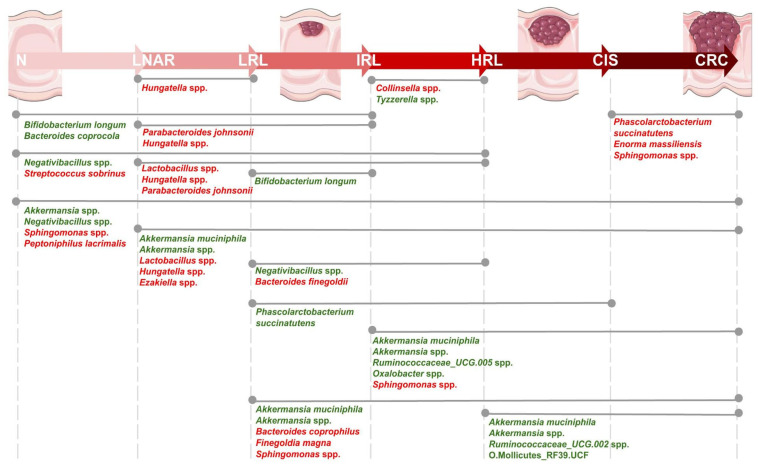
Figure 1.
Representation of the 34 bacterial species found as significantly differentially abundant in pairwise comparisons of diagnoses following the path from healthy colon to colorectal cancer (Tukey test, p.adjusted < 0.05, n = 2565). Different colonoscopy diagnoses are depicted from left to right following this path, with healthier states at the left and in the following order: N, negative; LNAR, lesion not associated to risk; LRL, low risk lesion; IRL, intermediate risk lesion; HRL, high risk lesion; CIS, carcinoma in situ; CRC, colorectal cancer. Lines connecting different diagnoses indicate comparisons, with differentially abundant species names indicated. Colors in the species names indicate the direction of the change with red indicating decrease and green increased relative abundance with respect to the healthier state.

