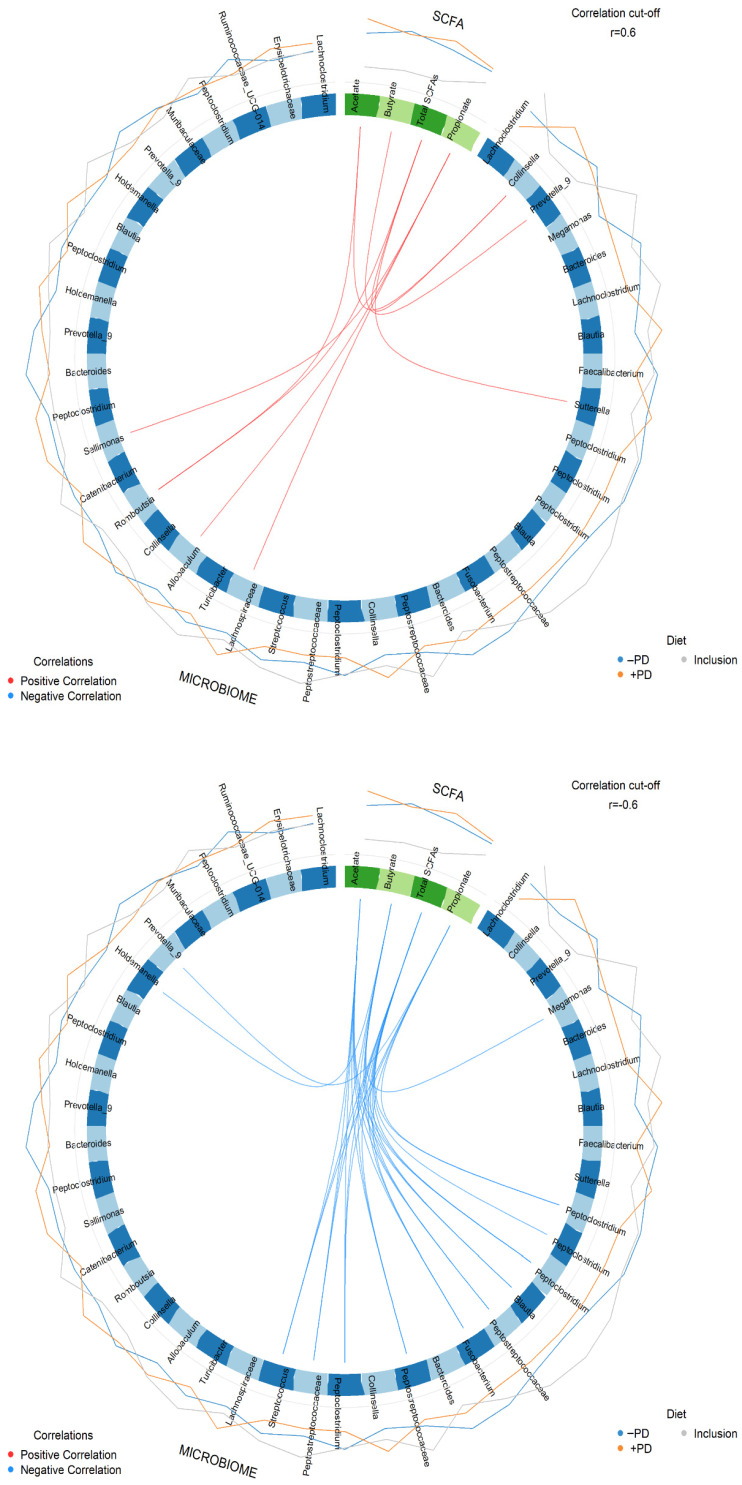
Figure 6.
Correlation between microbial abundance and faecal acetate, propionate, butyrate and total short chain fatty acids concentration (SCFA). Circos plot illustrating positive correlations (r ≥ 0.6, connecting red lines) and negative correlations (r ≤ −0.6, connecting blue lines) performed using multiblock sparse partial least squares discriminant analysis of faecal acetate, propionate, butyrate and total SCFAs, and relative abundance of faecal microbes at study inclusion (baseline samples, circumferential grey line), feeding a diet without (−PD, circumferential blue line) or with 109/kg Enterococcus faecium NCIMB 10415 (+PD, circumferential orange line).

