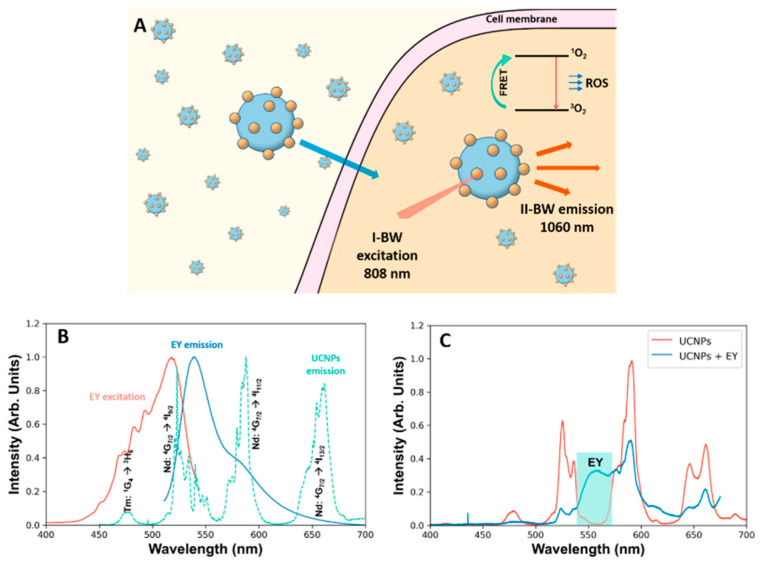
Figure 1.
(A) Schematic drawing of the working process of EY-coated NPs at a cellular level. (B) Excitation spectrum (red) and emission spectrum (blue) of EY. The emission of the UCNPs is also included in the graph (green). (C) Emission spectra of a solution of UCNPs and a solution of UCNPs + EY where the quenching effect can be observed especially at the Nd: 4G7/2 " 4I9/2 and Nd: 4G7/2 " 4I11/2 transitions.

