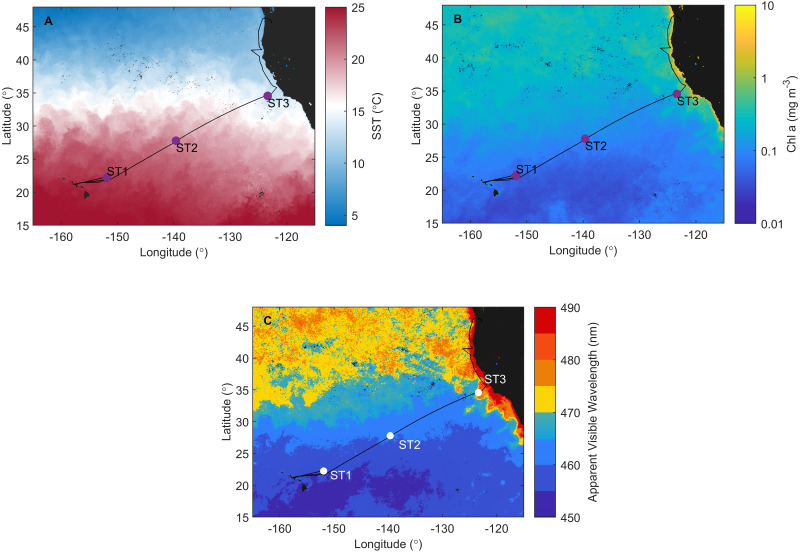
Figure 1. Investigation area superimposed on satellite data.
Cruise track of the Sea to Space cruise (black line), showing approximate position of Station 1, Station 2, and Station 3, superimposed onto: (A) MODIS Aqua Sea Surface temperature, (B) MODIS Aqua Chlorophyll a concentration, and (C) Apparent Visible Wavelength. All satellite data is monthly average for February 2017.

