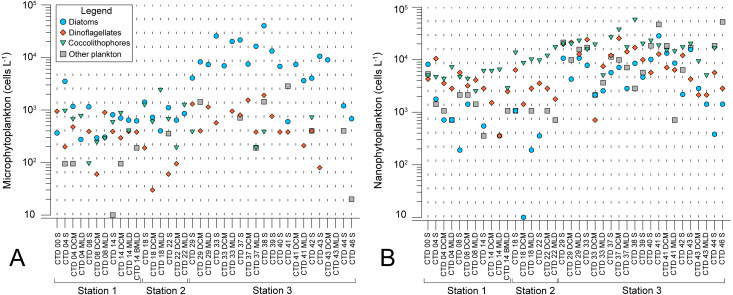
Figure 2. Spatial distribution of phytoplankton along the sampling transect in North Pacific.
(A) microphytoplankton fraction; (B) nanophytoplankton fraction. Stations (Station 1, Station 2, and Station 3) with sampling sites as CTD casts and corresponding depth (the surface layer (S), deep chlorophyll maximum (DCM), and mixed layer depth (MLD)) are shown on x-axis. Abundances (cellsL−1) of diatoms, dinoflagellates, coccolithophores, and others are shown on y-axis.

