Figure 1.
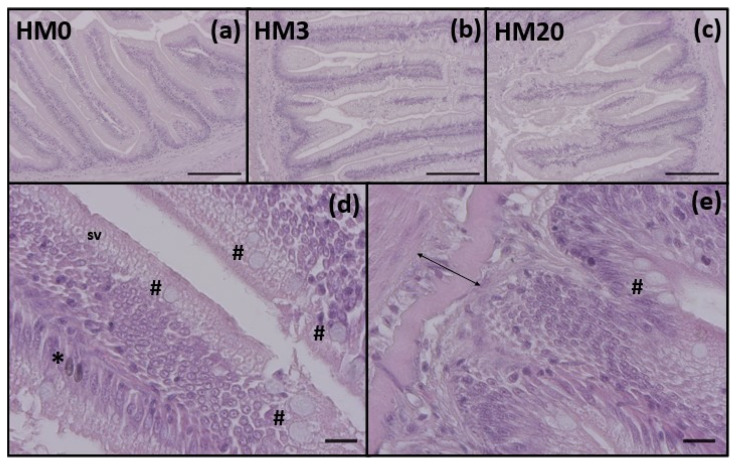
(a–c) Example of distal intestine histomorphology of rainbow trout fed experimental diets: (a) HM0, (b) HM3, and (c) HM20. (d,e) Details of mucosal folds (asterisk indicates melanomacrophages, hashtag indicate goblet cells, sv indicates supranuclear vacuoles and arrow indicate submucosa width). Scale bars: (a–c) = 200 μm; (d,e) = 20 μm.

