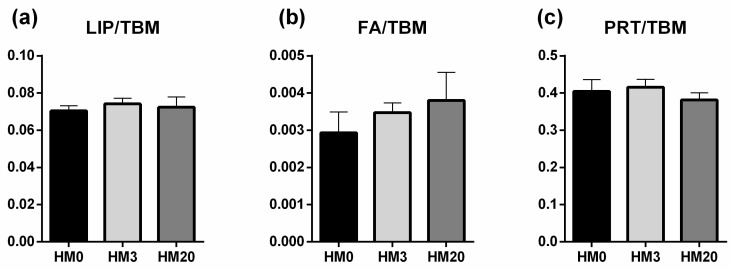
Figure 4.
Biochemical composition of liver samples of rainbow trout fed the experimental diets. Statistical analysis of (a) LIP/TBM (relative amount of lipids), (b) FA/TBM (relative amount of fatty acids), and (c) PRT/TBM (relative amount of proteins) band area ratios was performed. Values are shown as mean ± SD (n = 9).

