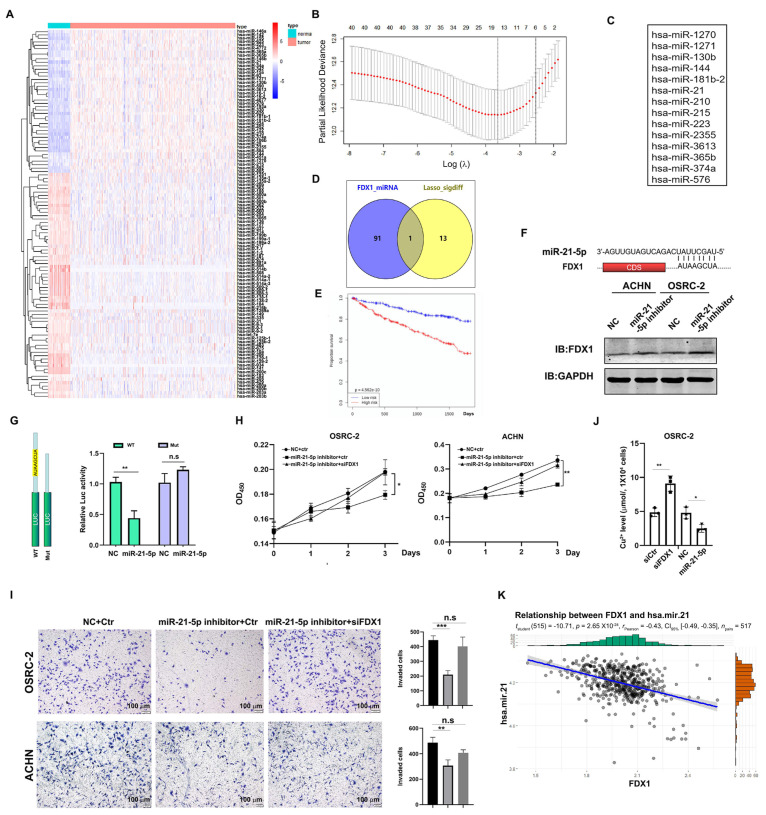
Figure 6.
Identification of miR-21-5p as the upstream regulator of FDX1. (A) A heap map of miRNAs differentially expressed between normal kidney tissues and ccRCC. (B) Prognosis-based LASSO analysis of the differential miRNAs. (C) A list of 14 miRNAs highly related to the prognosis. (D) A Venn diagram of 14 miRNAs and FDX1-targeted miRNAs. (E) High expression of miR-21-5p was associated with a short overall survival of ccRCC. (F) Top, the predicted binding site between the 3′-UTR of FDX1 and miR-21-5p. Bottom, miR-21-5p inhibitor treatment elevated FDX1 expression in both ACHN and OSRC-2 cells. GAPDH was the loading control. (G) Luciferase report assay showed that miR-21-5p mimics remarkably suppressed the activity of 3′-UTR of FDX1. (H) miR-21-5p inhibitor-suppressed cell growth of ACHN and OSRC-2 cells could be rescued by FDX1 knockdown. (I) miR-21-5p inhibitor-suppressed cell invasion of OSRC-2 cells could be blocked by FDX1 knockdown. Left, representative invading cells. Right, statistical analysis. Scale bar = 100 μm. (J) Cu2+ level in OSRC-2 cells before and after miR-21-5p inhibitor or siFDX1 treatment. (K) miR-21-5p expression was inversely correlated with FDX1 in TCGA-KIRC. * p < 0.05, ** p < 0.01, *** p < 0.001; n.s. = no significance.

