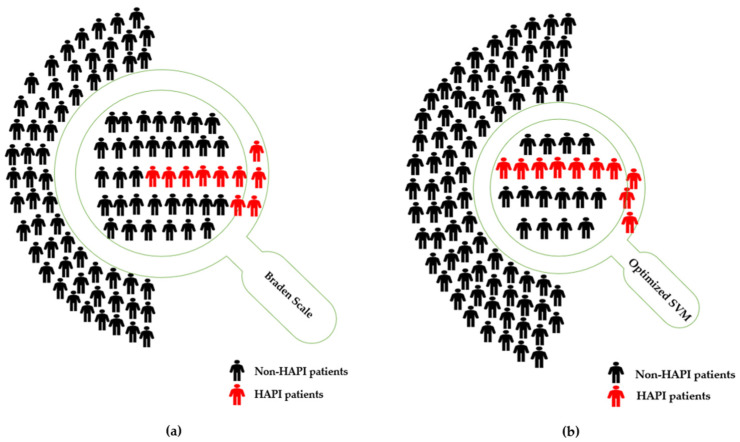
Figure 4.
(a) Illustrate a sample of 100 patients, where 10 of them have HAPI. Braden Scale alone: conduct prevention actions for 42 patients (i.e., detection prevalence), predict 6.6 patients with HAPI (i.e., sensitivity) correctly; (b) Illustrate a sample of 100 patients, where 10 of them have HAPI. Optimized SVM (with Braden): conduct prevention actions for 24 patients (i.e., detection prevalence), predict 7.4 patients with HAPI (i.e., sensitivity) correctly.

