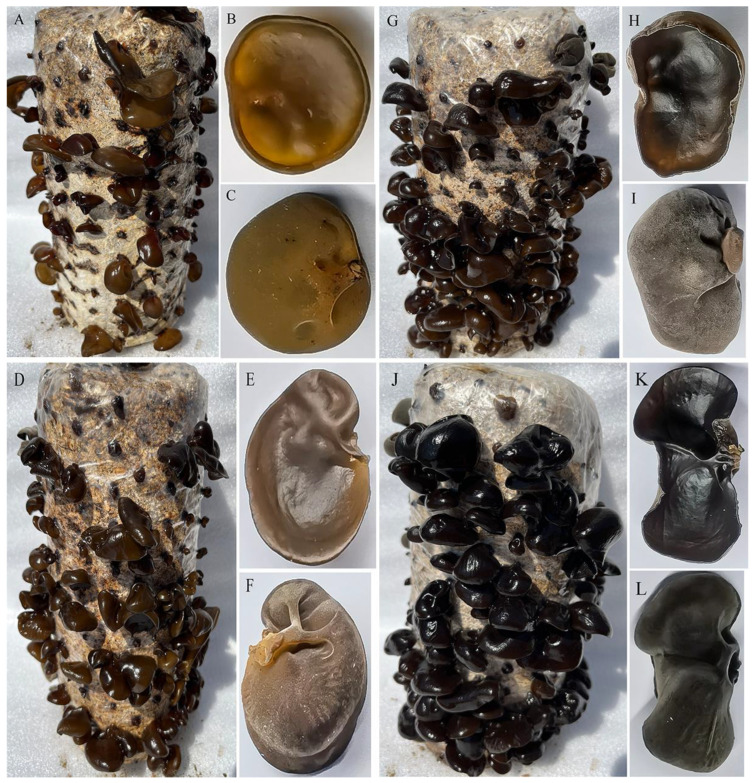
Figure 1.
Color features of the fruiting body collected from different light intensity treatments. (A–C) Color of the fruiting bodies grown under low light intensity (B1: 10 μmol·m−2·s−1). (D–F) Color of the fruiting bodies grown under the light intensity of 50 μmol·m−2·s−1 (B2). (G–I) The color of the fruiting bodies grew under the light intensity of 250 μmol·m−2·s−1(B3). (J–L) The color of the fruiting bodies grew under the light intensity of 500 μmol·m−2·s−1 (B4).

