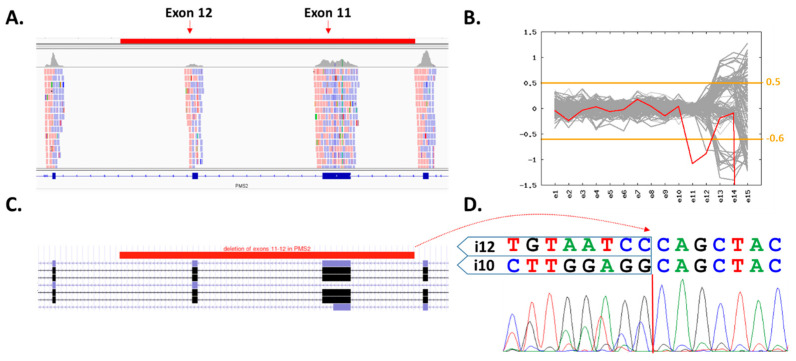
Figure 2.
Characterization of exons 11–12 (8907 bp) PMS2 deletion. (A) Integrated Genome Viewer (IGV) visualization of the coverage decrease suggesting a presence of heterozygous two-exon deletion (highlighted region in red). (B) Visualization of CNV analyses generated using the CNVkit (patient’s sample in red). The inconsistent region covering exons 12–15 contains numerous PMS2 pseudogenes. (C) Schematic region of deletion in UCSC genome browser. (D) Characterization of the deletion breakpoint with Sanger sequencing.

