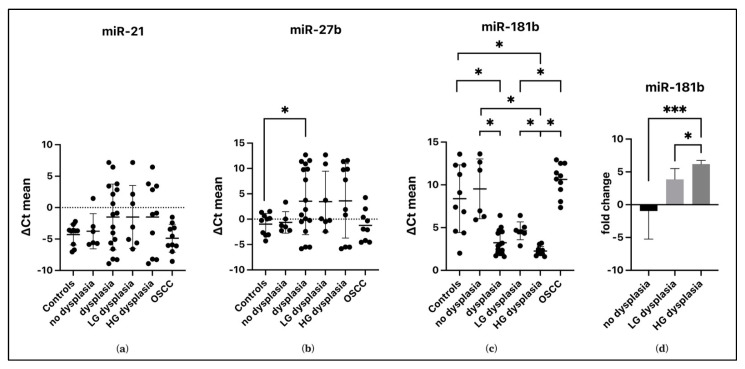
Figure 1.
Salivary miRNAs expression in OED, ND, OSCC groups and in Controls. Subgroups HG and LG dysplasia were added. The ΔCt mean of all salivary samples from patients for each miRNA is represented (a–c). The fold change of miR-181b within the OPMD group is reported (d). Asterisk = the comparison between groups, is significant for * p ≤ 0.05, *** p ≤ 0.001.

