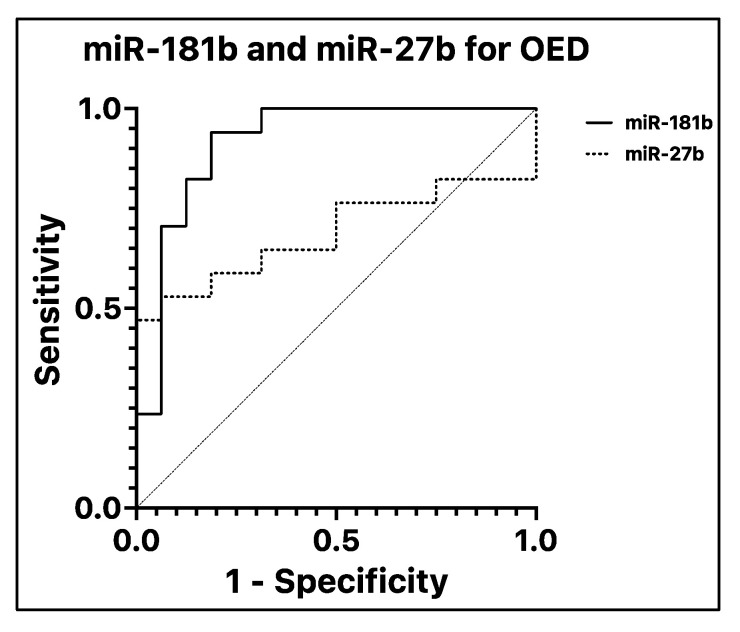
Figure 2.
Receiver operating characteristic curve (ROC) and area under the curve (AUC). ROCanalysis of miR-181b (straight line) and miR-27b (dotted line) for discriminating OED from OPMD without dysplasia (ND and control groups). MiR-181b has very good diagnostic values in terms of sensitivity and specificity (AUC = 0.9154; standard error = 0.05315; 95% C.I. = 0.8113 to 1); miR-27b, on the other hand, is below the acceptable threshold (AUC = 0.6875; standard error = 0.09916; 95% C.I. = 0.4931 to 0.8819). The reference line is represented with a dashed line.

