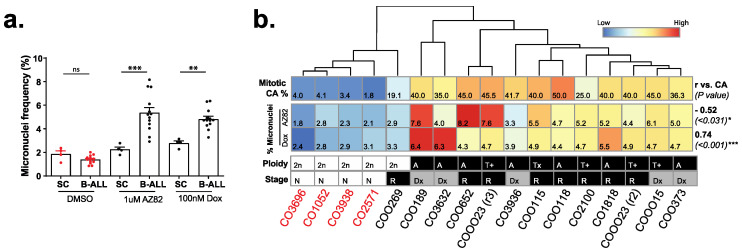
Figure 5.
(a) Frequency of micronuclei in 4 primary bone marrow stem cell (SC) samples and 13 primary B-ALL samples incubated with 1 μM AZ82, 100 nM Doxorubicin, or DMSO for 48 h. (mean ± SEM, unpaired two-tailed t-test, ** p < 0.01, *** p < 0.001, ns = not significant). (b) Correlation between % CA and % micronuclei for 13 primary B-ALL samples and four primary bone marrow stem cell samples incubated in 1 μM AZ82 or 100nM Doxorubicin. Heatmap columns are ordered by hierarchical clustering based on average linkage, and rows are scaled by Z-score. Pearson r (vs. CA) values (bold) and the p-value (in parentheses) are on the right side (Pearson r, * p < 0.05, *** p < 0.001). Primary sample ploidy (2n = Euploid, A = aneuploid, T+ = translocation aneuploid), and stage (N = none, Dx = initial diagnosis, R = relapse) are indicated below the heatmap.

