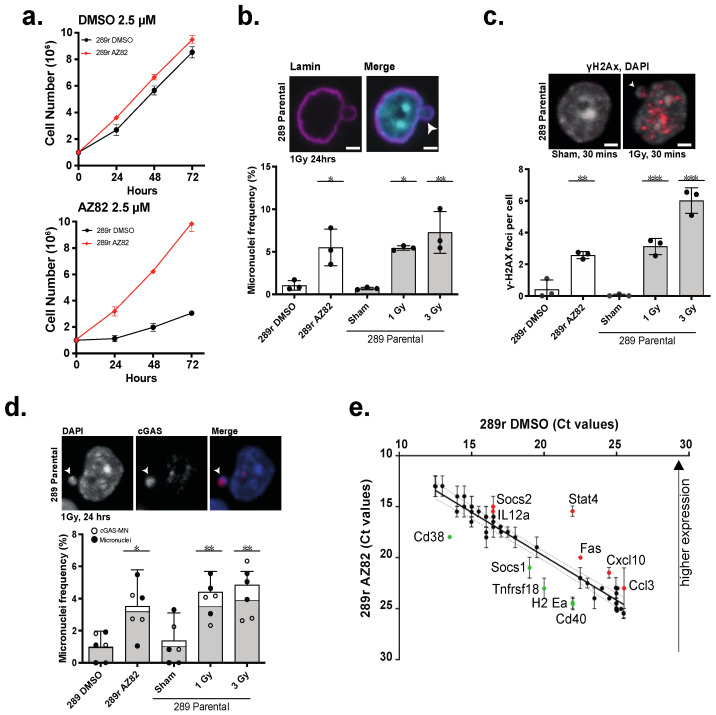
Figure 6.
(a) Cell proliferation of 289r AZ82 and 289r DMSO cells incubated with 2.5 μM AZ82 or 2.5 μM DMSO over 72 h. (mean ± SEM, n = 3 experiments). (b) Micronuclei frequency in 289r AZ82 and 289r DMSO cells, and 289 parental cells 24 h after three X-irradiation conditions (sham, 1 Gy, 3 Gy). (mean ± SEM, n = 3 experiments, >500 cells per bar, * p < 0.05, ** p < 0.01, One-way ANOVA). Image shows 289 parental cell line 24 h post 1 Gy X-irradiation stained with lamin and DAPI. Arrow indicates a micronucleus. Scale bar = 2 μm. (c) γ-H2Ax foci per cell in 289r AZ82 and 289r DMSO cells, and 289 parental cells 24 h after three X-irradiation conditions (sham, 1 Gy, 3 Gy). (mean ± SEM, n = 3 experiments, >500 cells per bar, ** p < 0.01, *** p < 0.001, One-way ANOVA). Image shows 289 parental cell line 30 min post 1 Gy X-irradiation or sham treatment stained with γ-H2Ax and DAPI. Arrow indicates a micronucleus. Scale bar = 2 μm. (d) Frequency of micronuclei (white) and micronuclei co-localized with cGAS (grey) per cell in 289r AZ82 and 289r DMSO cells, and 289 parental cells 24 h after three X-irradiation conditions (sham, 1 Gy, 3 Gy). (mean ± SEM, n = 3 experiments, >500 cells per bar, * p < 0.05, ** p < 0.01, One-way ANOVA). Image shows 289 parental cell line 30 min post 1 Gy X-irradiation or sham treatment stained with cGAS and DAPI. Arrow indicates a micronucleus. Scale bar = 2 μm. (e) Ct values for expression of 48 mouse immune genes between 289r AZ82 and 289r DMSO control cell lines. Each dot represents a gene and dotted lines show the associated 95% confidence interval. Red or green color indicate the up- or down-regulated genes, respectively in 289r (AZ82) cells. (n = 2 experiments, mean ± SEM).

