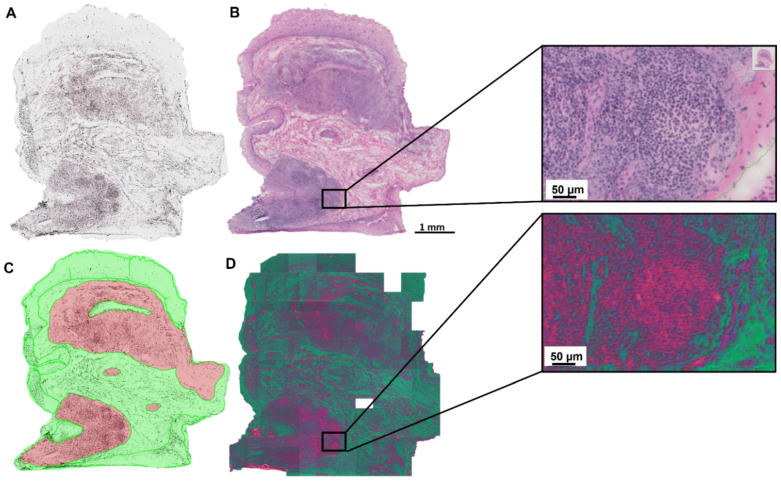
Figure 2.
False color image representing the results of the Umap dimensionality reduction. (A) unstained tissue section. (B) H&E stained tissue section. (C) Manual histopathological annotations on H&E-stained tissue section. (D) False color image to visualize the results of the dimensionality reduction algorithm. Red feature: cytoplasm, green feature: background, collagen and the extracellular matrix, blue feature: nuclei. The empty white tile in (D) was removed from the dataset due to a lack of tissue or poor matching between HSI and microscopic imaging.

