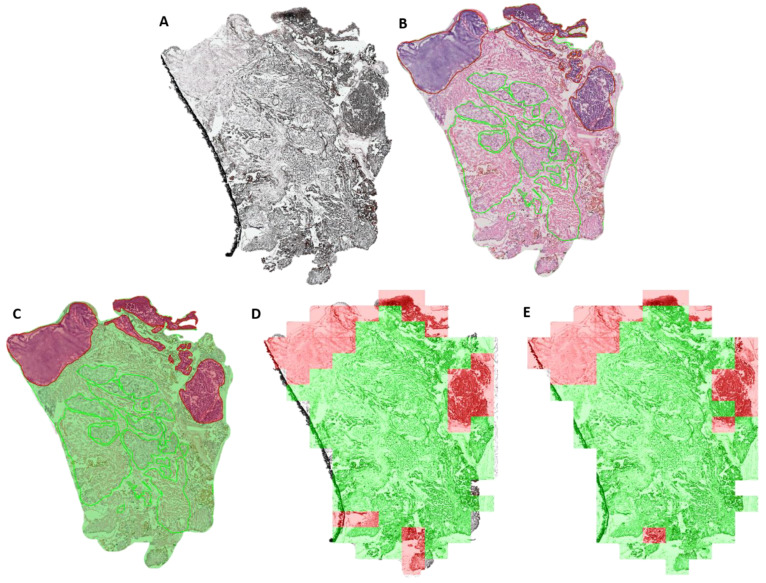
Figure 3.
Visualization of the tumor classification results of 3.1.3 and 3.1.4 on an exemplary tissue section. (A) unstained tissue section. (B) H&E stained tissue section. (C) Manual histopathological annotations. (D) Tumor classification using a fine-tuned ResNet architecture on false color images. (E) Tumor classifications results using a 3D CNN on the full hyperspectral data cubes. Green: healthy tissue. Red: Tumor tissue.

