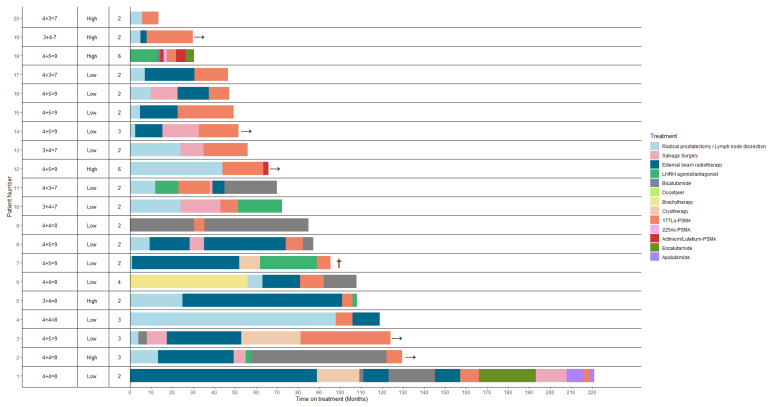
Figure 1.
Swimmer plot illustrating the duration in months of each treatment per patient. Columns from left to right, initial Gleason Score; tumor volume at baseline (low volume was defined as having a maximum of 5 metastases); the amount of cycles each patient has received. Five patients have an ongoing response (indicated by the arrow), one patient has deceased (indicated by cross).

