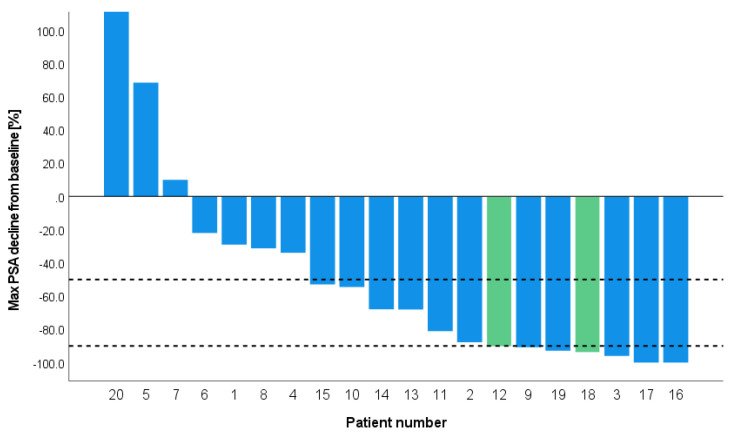
Figure 2.
Waterfall plot of the individual changes of best PSA-response following PSMA−RLT. Blue bars indicate patients treated with 177Lu−PSMA and green bars with 177Lu−PSMA and 225Ac−PSMA. The two black lines represent ≥50% and ≥90% PSA decline. mHSPC = metastatic hormone sensitive prostate cancer; PSA = prostate specific antigen; PSMA = prostate specific membrane antigen; RLT = radioligand therapy.

