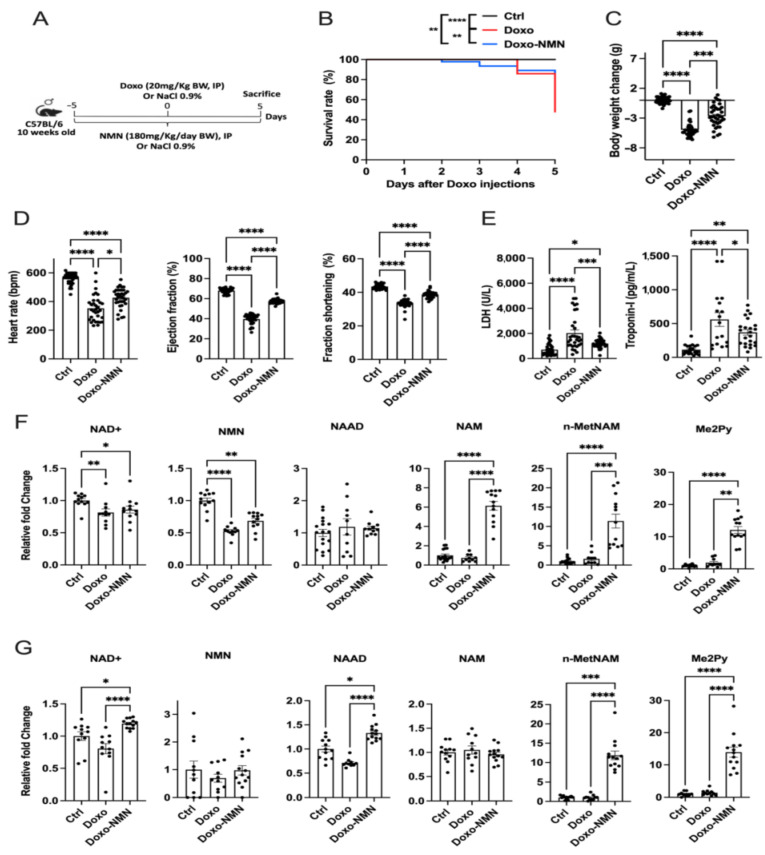
Figure 1.
Treatment of NMN improves survival, body weight loss and cardiac function impaired by acute Doxo toxicity and affects the NAD+ metabolome in their bloodstream and heart. (A) Study design for the acute regime in Doxo-induced cardiotoxicity mouse model. Treatment with NMN (180 mg/kg/day, i.p.) was initiated 5 days before the Doxo injection (20 mg/kg, i.p.) and continued over 5 days. Survival rate, body weight variation and cardiac function were assessed as described in methods. (B) Survival curve (percentage, %) of Ctrl, Doxo and Doxo-NMN mice. Log-rank (Mantel–Cox) test. ** p < 0.01, **** p < 0.0001. (C) Body weight variation at the end of the treatment period. Body weight variation has been calculated as follows: Body weight at the day of sacrifice (day 5)—body weight at the day of Doxo-injection (day 0). Nonparametric Kruskal–Wallis test followed by Dunn’s post-test. *** p < 0.001, **** p < 0.0001. (D) Cardiac function at the end of the treatment period. Heart rate, ejection fraction and fraction shortening were assessed by echocardiography on day 5. Nonparametric Kruskal–Wallis test followed by Dunn’s post-test. * p < 0.05, **** p < 0.0001. (E) LDH and troponin–-I levels at the end of the treatment period. One-way Anova followed by Tukey’s post-test. * p < 0.05, ** p < 0.01 *** p < 0.001, **** p < 0.0001. (F) Levels of NAD+, NMN, NAAD, NAM, n-MetNAM and Me2Py (relative to Ctrl group) in blood on day 5. Nonparametric Kruskal–Wallis test followed by Dunn’s post-test were used for NAD+, NMN, NAM, n-MetNAM and Me2Py and One-way Anova followed by Tukey’s post-test were used for NAAD. * p < 0.05, ** p < 0.01, *** p < 0.001, **** p < 0.0001. (G) Levels of NAD+, NMN, NAAD, NAM, n-MetNAM and Me2Py (relative to Ctrl group) in heart on day 5. Nonparametric Kruskal–Wallis test followed by Dunn’s post-test were used for NAD+, NAAD and n-MetNAM and One-way Anova followed by Tukey’s post-test were used for NMN, NAM and Me2Py. * p < 0.05, *** p < 0.001, **** p < 0.0001. Data are shown as means ± the standard error.

